Vegetation plot records (relevés) are standardized descriptions of plant community composition of defined small areas of typically 1-1000 m² in size. On these areas, all occurring plant species (vascular plants, but often also bryophytes, lichens and algae) are recorded, together with an importance value (e.g. % cover or cover-abundance classes of Braun-Blanquet). Additionally, they contain information on the structure of the vegetation (cover and height in total and of individual layers), location, time and in most cases at least some environmental factors measured or estimated in the plot (e.g. slope and aspect, relief position, land use type, soil parameters).
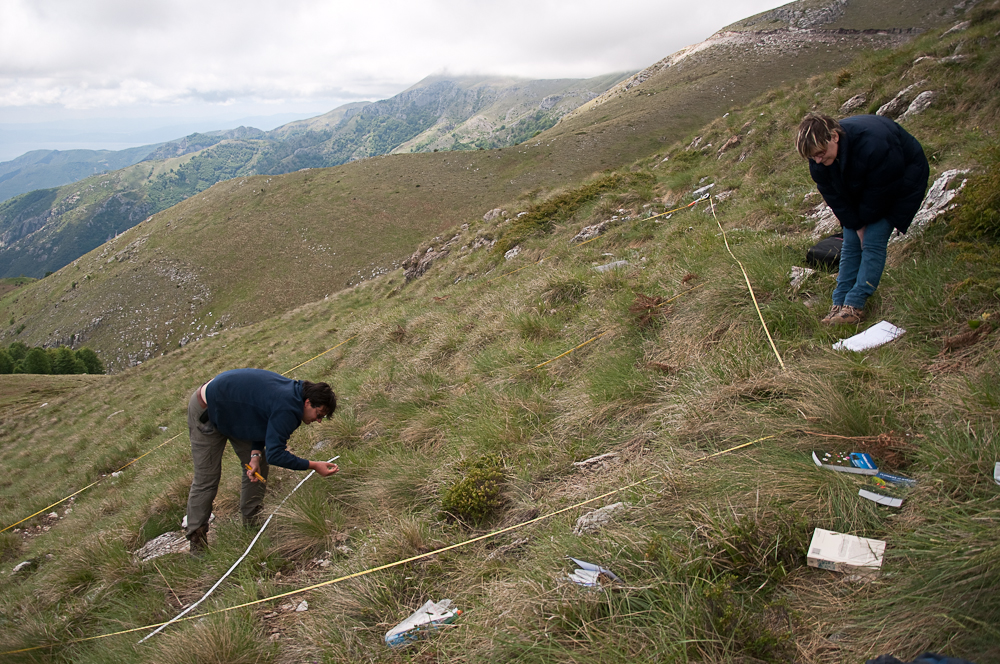
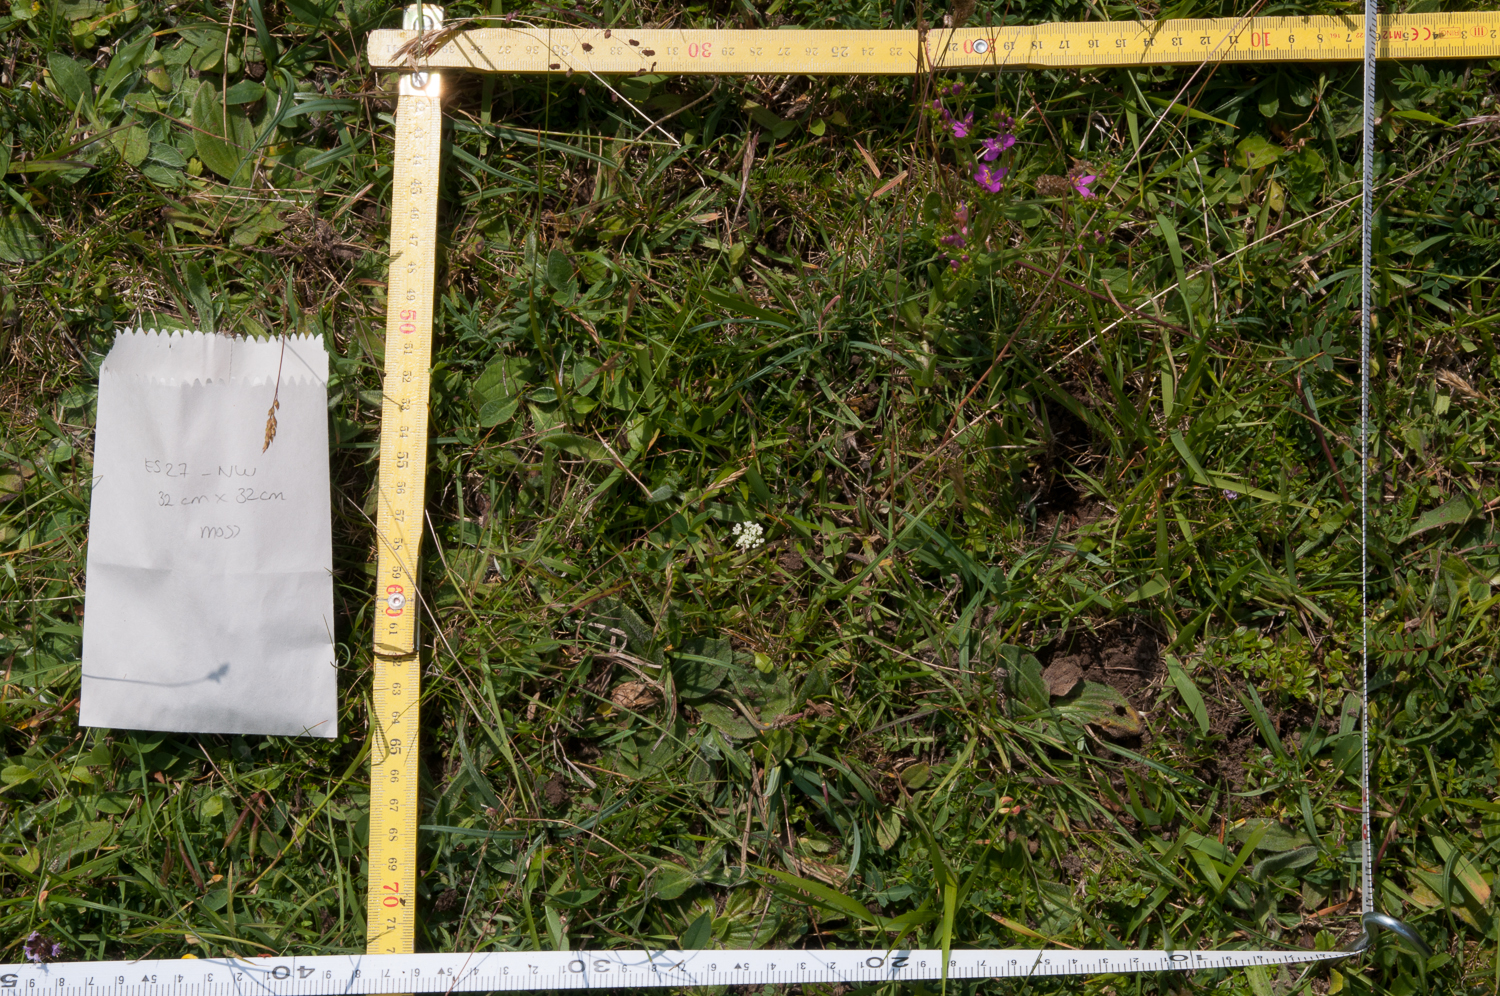
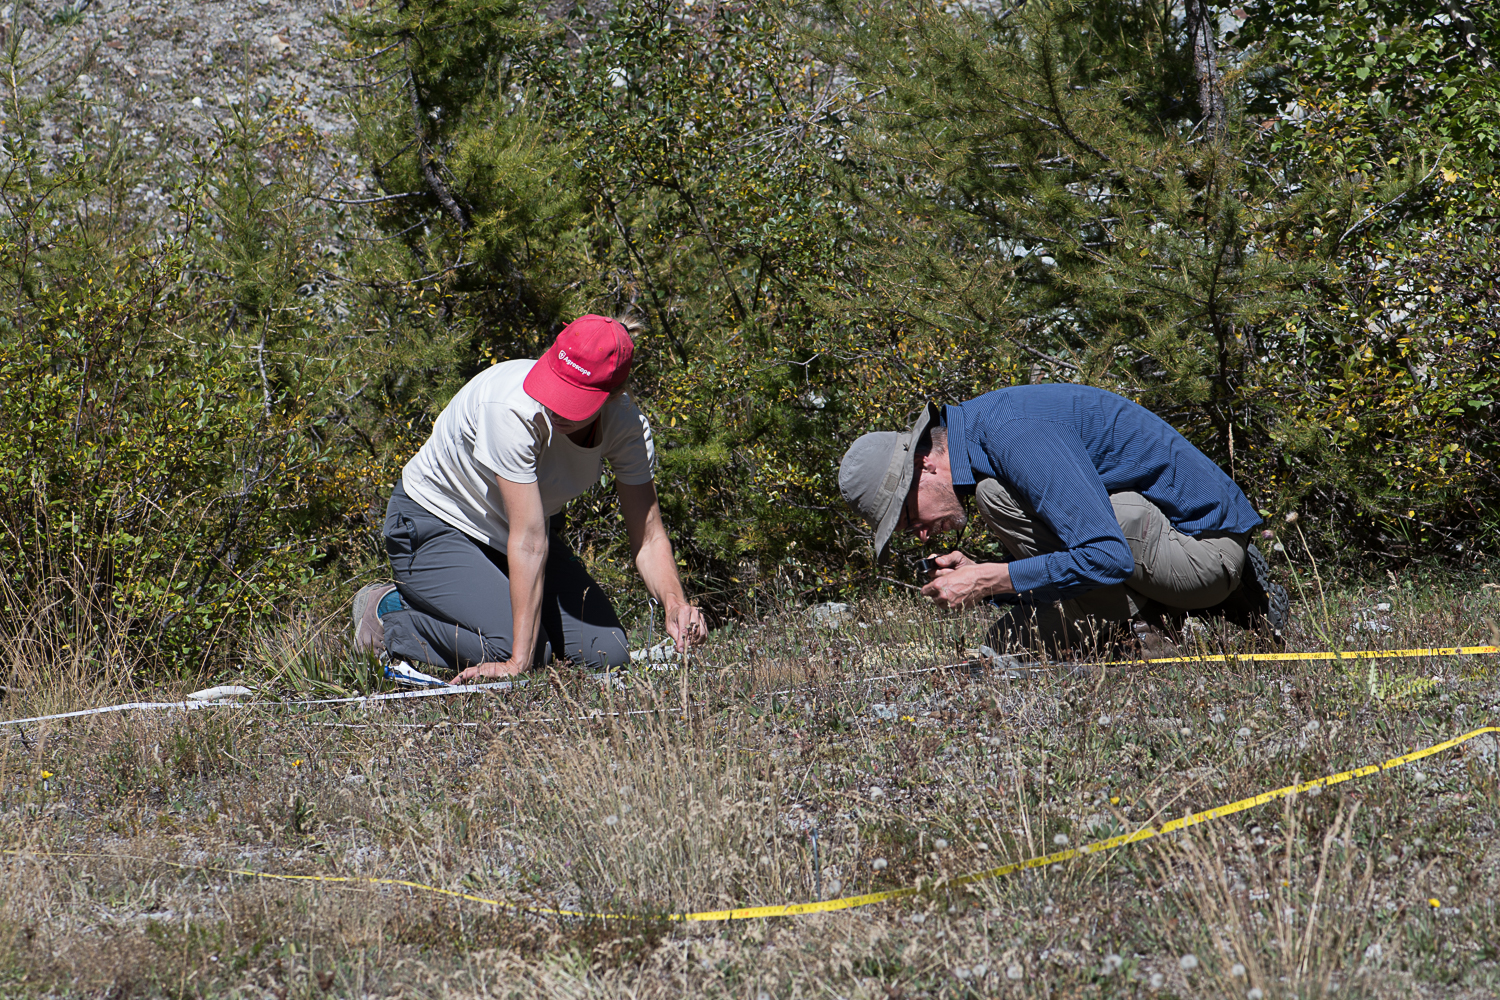
Left: Sampling a 10-m2 plot in a mountain grassland in Northern Greece. Middle: Very species-rich 0.1-m2 plot in a grazed meso-xeric grassland in Navarre, Spain. Right: Sampling an EDGG Biodiversity Plot on a moraine in Valais, Switzerland. Photos by J. Dengler
Vegetation plot records are used in one way or another in most plant community ecological research. They have been sampled all around the world in a relatively uniform manner since about 100 years. This results in estimated 5-10 million existing relevés in Europe (with its strong phytosociological tradition) and perhaps 10-20 million worldwide. Such vegetation plots have big advantages for macroecological studies of plants and vegetation over more widely used data sources such as the Global Biodiversity Information Facility (GBIF) that provides point distribution data for individual species:
- they provide true community data of species co-occurring in close neighbourhood and sharing the same environmental conditions and competing for the same resources,
- they provide information on dominance and frequency of each species,
- they contain information on true absences (i.e. a species not listed for a plot does not occur there, which is not the case with GBIF data), an important feature for modelling studies, and
- they typically contain at least some structural and environmental parameters determined locally (while GBIF studies have to rely exclusively on modelled environmental parameters at much coarser scale)
Additionally, the distribution data of individual species that is contained in plot data, if mobilised, would enormously expand the data content of GBIF. Still the construction of large vegetation-plot data lagged behind that of GBIF and other species-based data mainly because of the significantly more complex data structure. However, first sizeable national and regional vegetation-plot databases emerged since the late 1990s, first in the United Kingdom, followed by the Netherlands, the federal state of Mecklenburg-Vorpommern in Germany, the Czech Republic and the Basque Country in Spain.
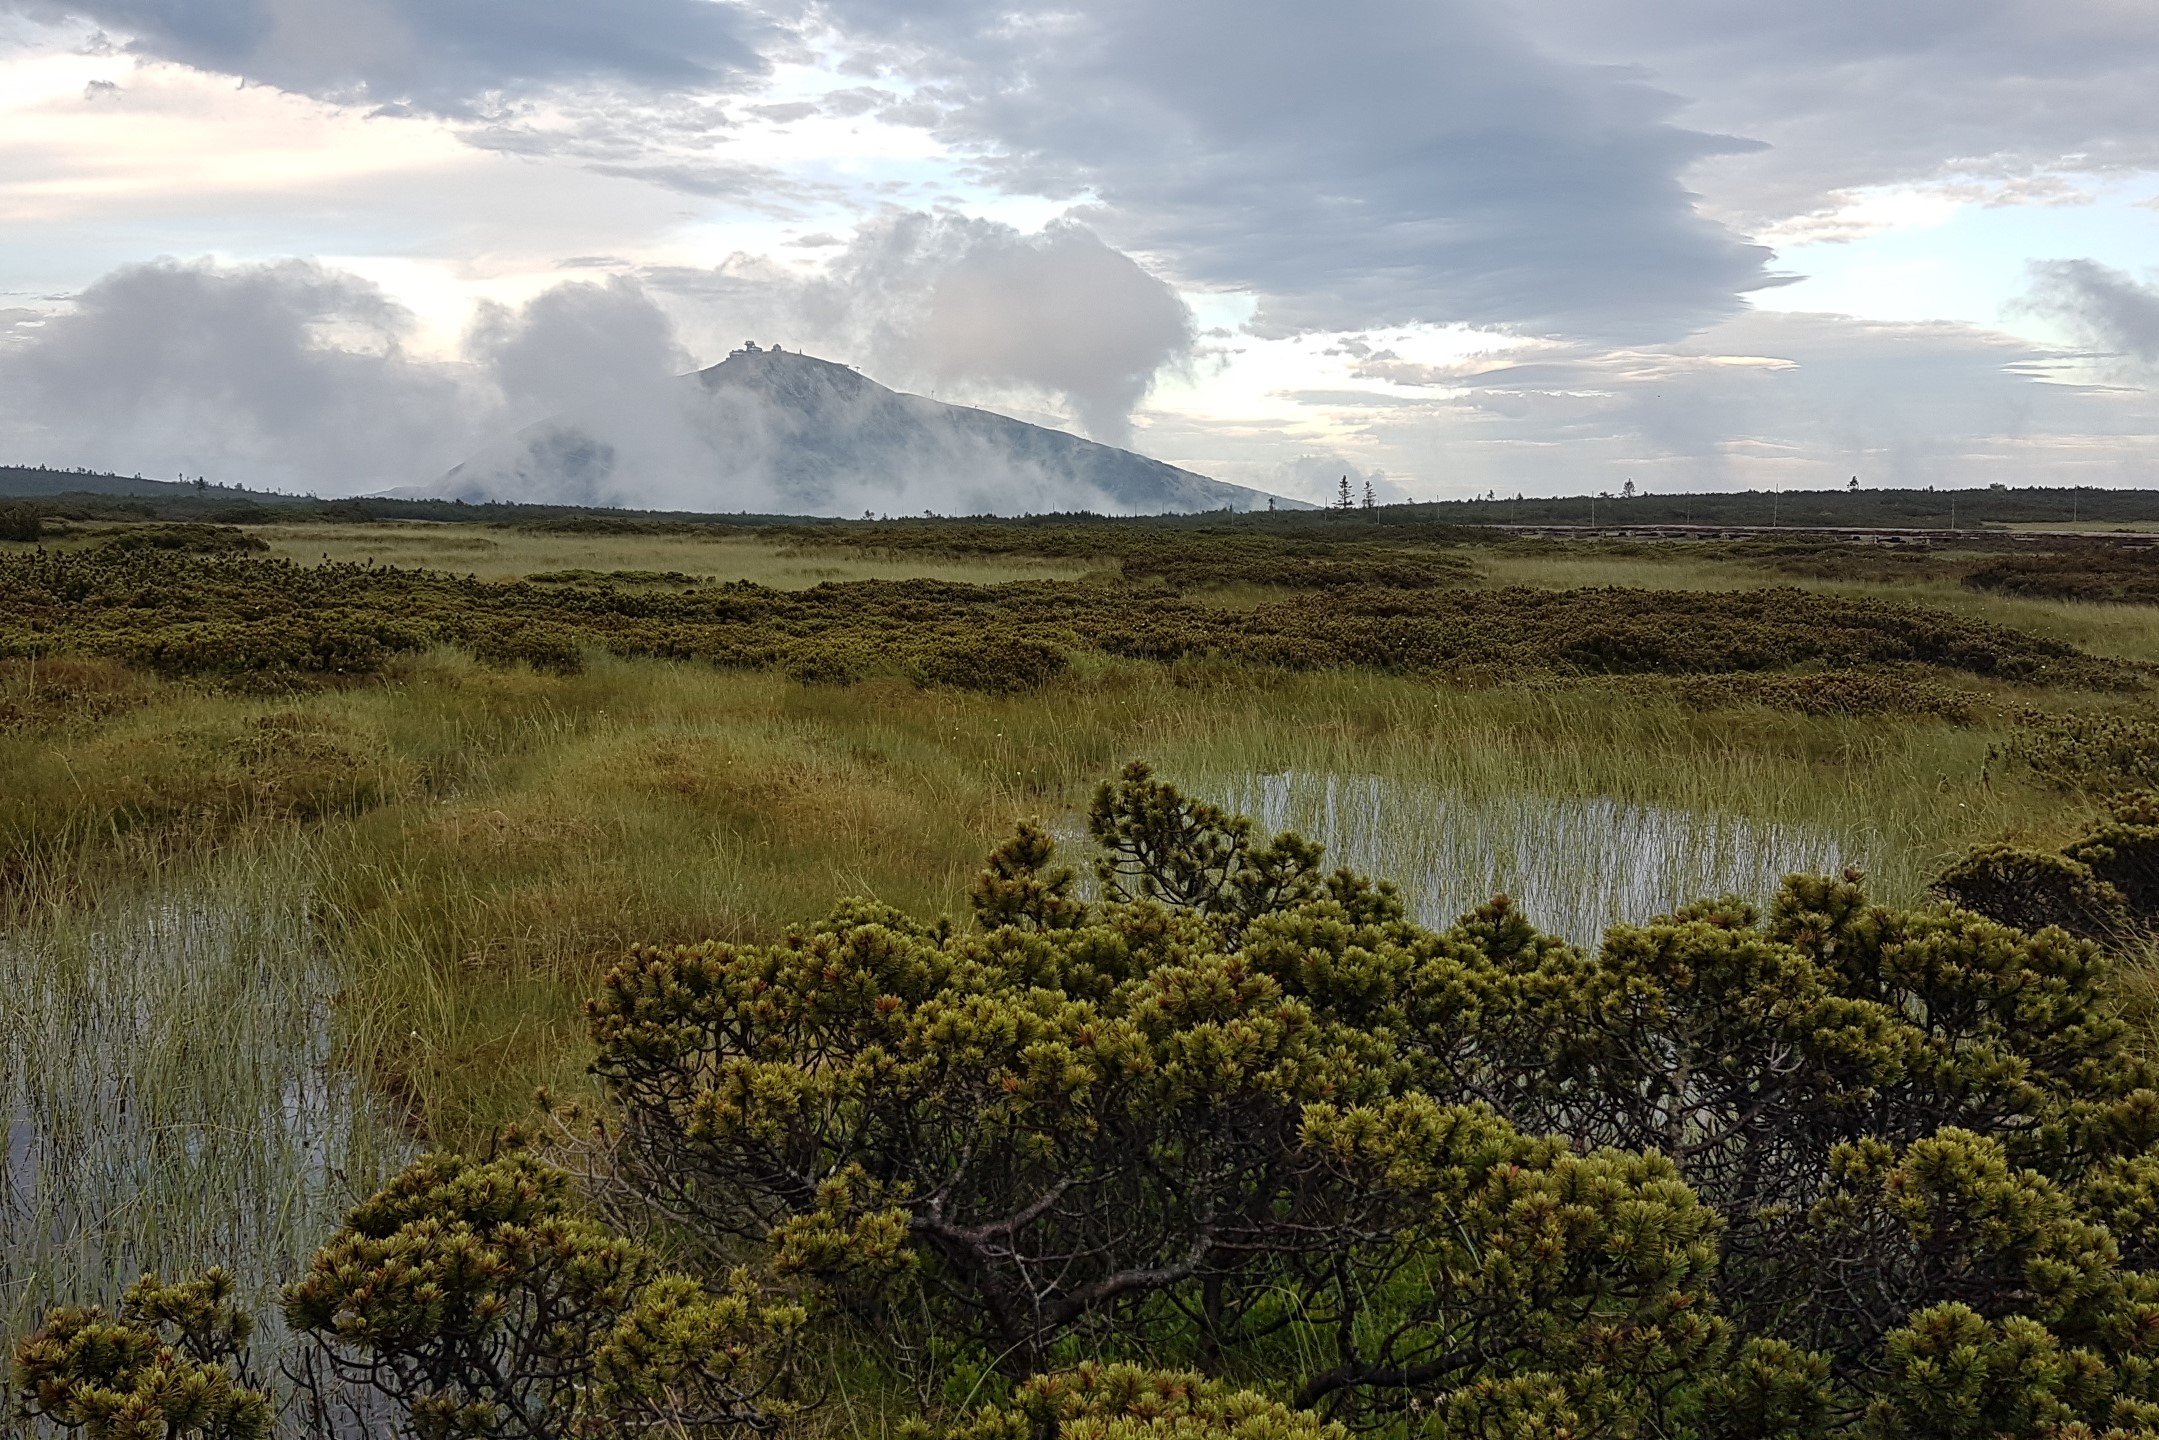
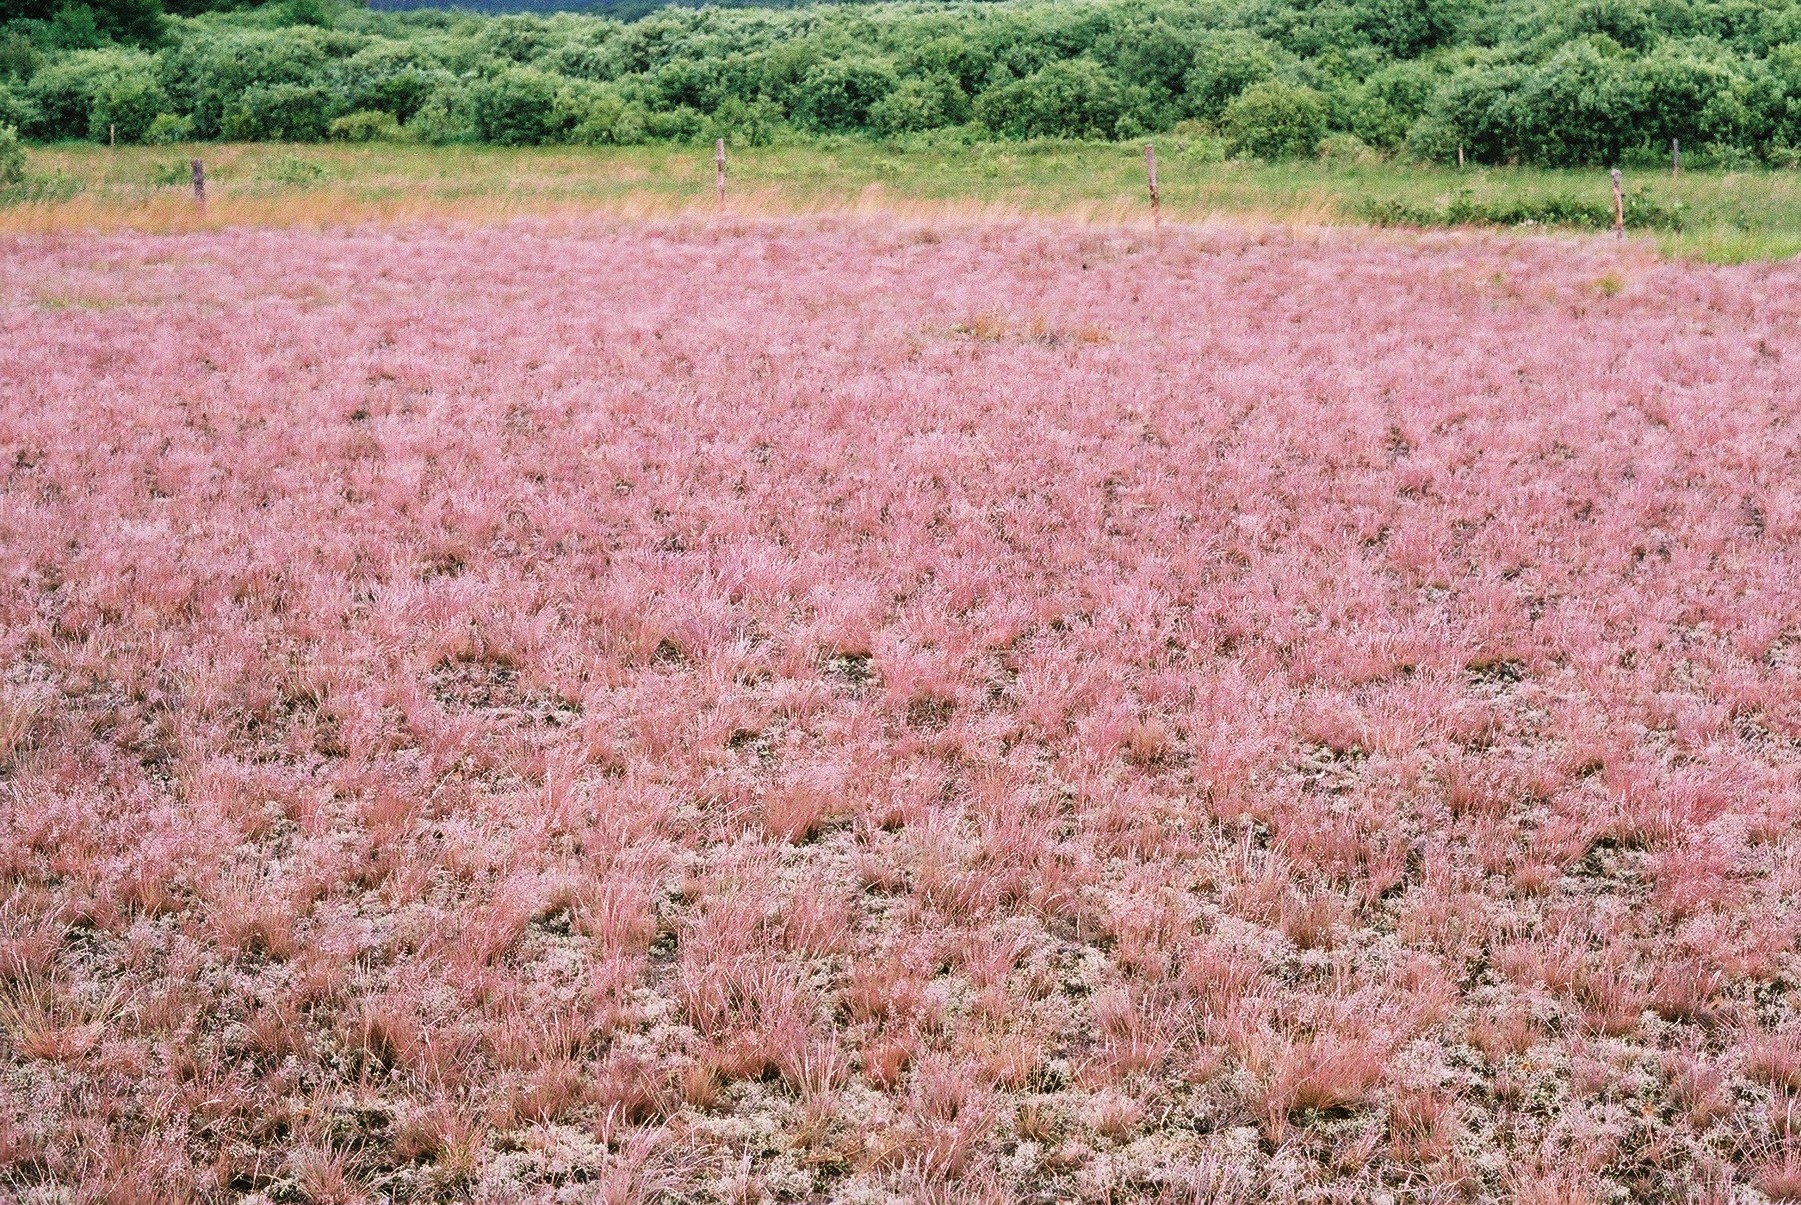
Examples of a subalpine wetland in the Karkonosze Mts. SW Poland (left), a sandy grassland dominated by Corynephorus canescens in western Poland (middle), and a coastal shrubland with dwarf palms, Italy (right). Photos by R. Pielech and R. Guarino (right)
The Global Index of Vegetation-Plot Databases (GIVD), launched in 2010, provided for the first time a global metadatabase of existing vegetation-plot databases. To cope with the problems of unifying many different taxonomic concepts of national databases, as well as their varying database structures, large supranational databases emerged during the last years; the European Vegetation Archive (EVA) in 2012 and the Global vegetation-plot database “sPlot” in 2014. Meanwhile EVA contains about 1.6 million plots and sPlot close to 2 million plots. It is evident that with this high number and good spatial coverage, both integrated databases will open a new era of plant community ecology, macroecology and biogeography. A whole series of first analyses is on its way, some of them already published.
EDGG has played a pivotal role in the establishment of several regional plot databases devoted to European grasslands or open habitats in general, which were then fed into EVA and sPlot. Moreover, EDGG has established its own database GrassPlot focusing on multi-scale plant diversity data in Palaearctic grasslands. Based on the about 200,000 plots in GrassPlot, we can offer an online tool to explore grassland diversity in the Palaearctic across scales, taxa, syntaxa and regions.
Literature
Special Issue of Journal of Vegetation Science on “Ecoinformatics and global change” (eds. J. Dengler, J. Ewald, I. Kühn & R.K. Peet) (2011) PDF
Special Issue of Biodiversity & Ecology on “Vegetation databases for the 21st century” (eds. J. Dengler, J. Oldeland, F. Jansen, M. Chytrý, J. Ewald, M. Finckh, F. Glöckler, G. Lopez-Gonzalez, R.K. Peet & J.H.J. Schaminée) (2012) PDF
Bruelheide, H., Dengler, J., Jiménez-Alfaro, B., Purschke, O., Hennekens, S.M., Chytrý, M., Pillar, V.D., Jansen, F., Kattge, J., (…) & Zverev, A. 2019. sPlot – A new tool for global vegetation analyses. Journal of Vegetation Science, 30, 161-186. PDF
Chytrý, M., Hennekens, S.M., Jiménez-Alfaro, B., Knollová, I., Dengler, J., Jansen, F., Landucci, F., Schaminée, J.H.J., Aćić, S., (…) & Yamalov, S. 2016. European Vegetation Archive (EVA): an integrated database of European vegetation plots. Applied Vegetation Science 19: 173–180.
Dengler, J., Chytrý, M. & Ewald, J. 2008. Phytosociology. In: Jørgensen, S.E. & Fath, B.D. (eds.) Encyclopedia of ecology, pp. 2767–2779. Elsevier, Oxford, UK. PDF
Dengler, J., Jansen, F., Glöckler, F., Peet, R.K., De Cáceres, M., Chytrý, M., Ewald, J., Oldeland, J., Lopez-Gonzalez, G., Finckh, M., Mucina, L., Rodwell, J.S., Schaminée, J.H.J., Spencer, N. 2011. The Global Index of Vegetation-Plot Databases (GIVD): a new resource for vegetation science. Journal of Vegetation Science 22: 582–597. PDF
Dengler, J., Wagner, V., Dembicz, I., García-Mijangos, I., Naqinezhad, A., Boch, S., Chiarucci, A., Conradi, T., Filibeck, G., (…) & Biurrun, I. 2018. GrassPlot – a database of multi-scale plant diversity in Palaearctic grasslands. Phytocoenologia 48: 331–347.
