GrassPlot is the EDGG-affiliated database of multi-scale plant diversity in Palaearctic grasslands. The database started as a repository for the data collected at the Research Expeditions/Field Workshops of the Eurasian Dry Grassland Group (EDGG) and similar multi-scale sampling schemes. It formerly was named "Database Species-Area Relationships in Palaearctic Grasslands". GrassPlot is registered under the code EU-00-003 in the Global Index of Vegetation-Plot Databases (GIVD; www.givd.info).
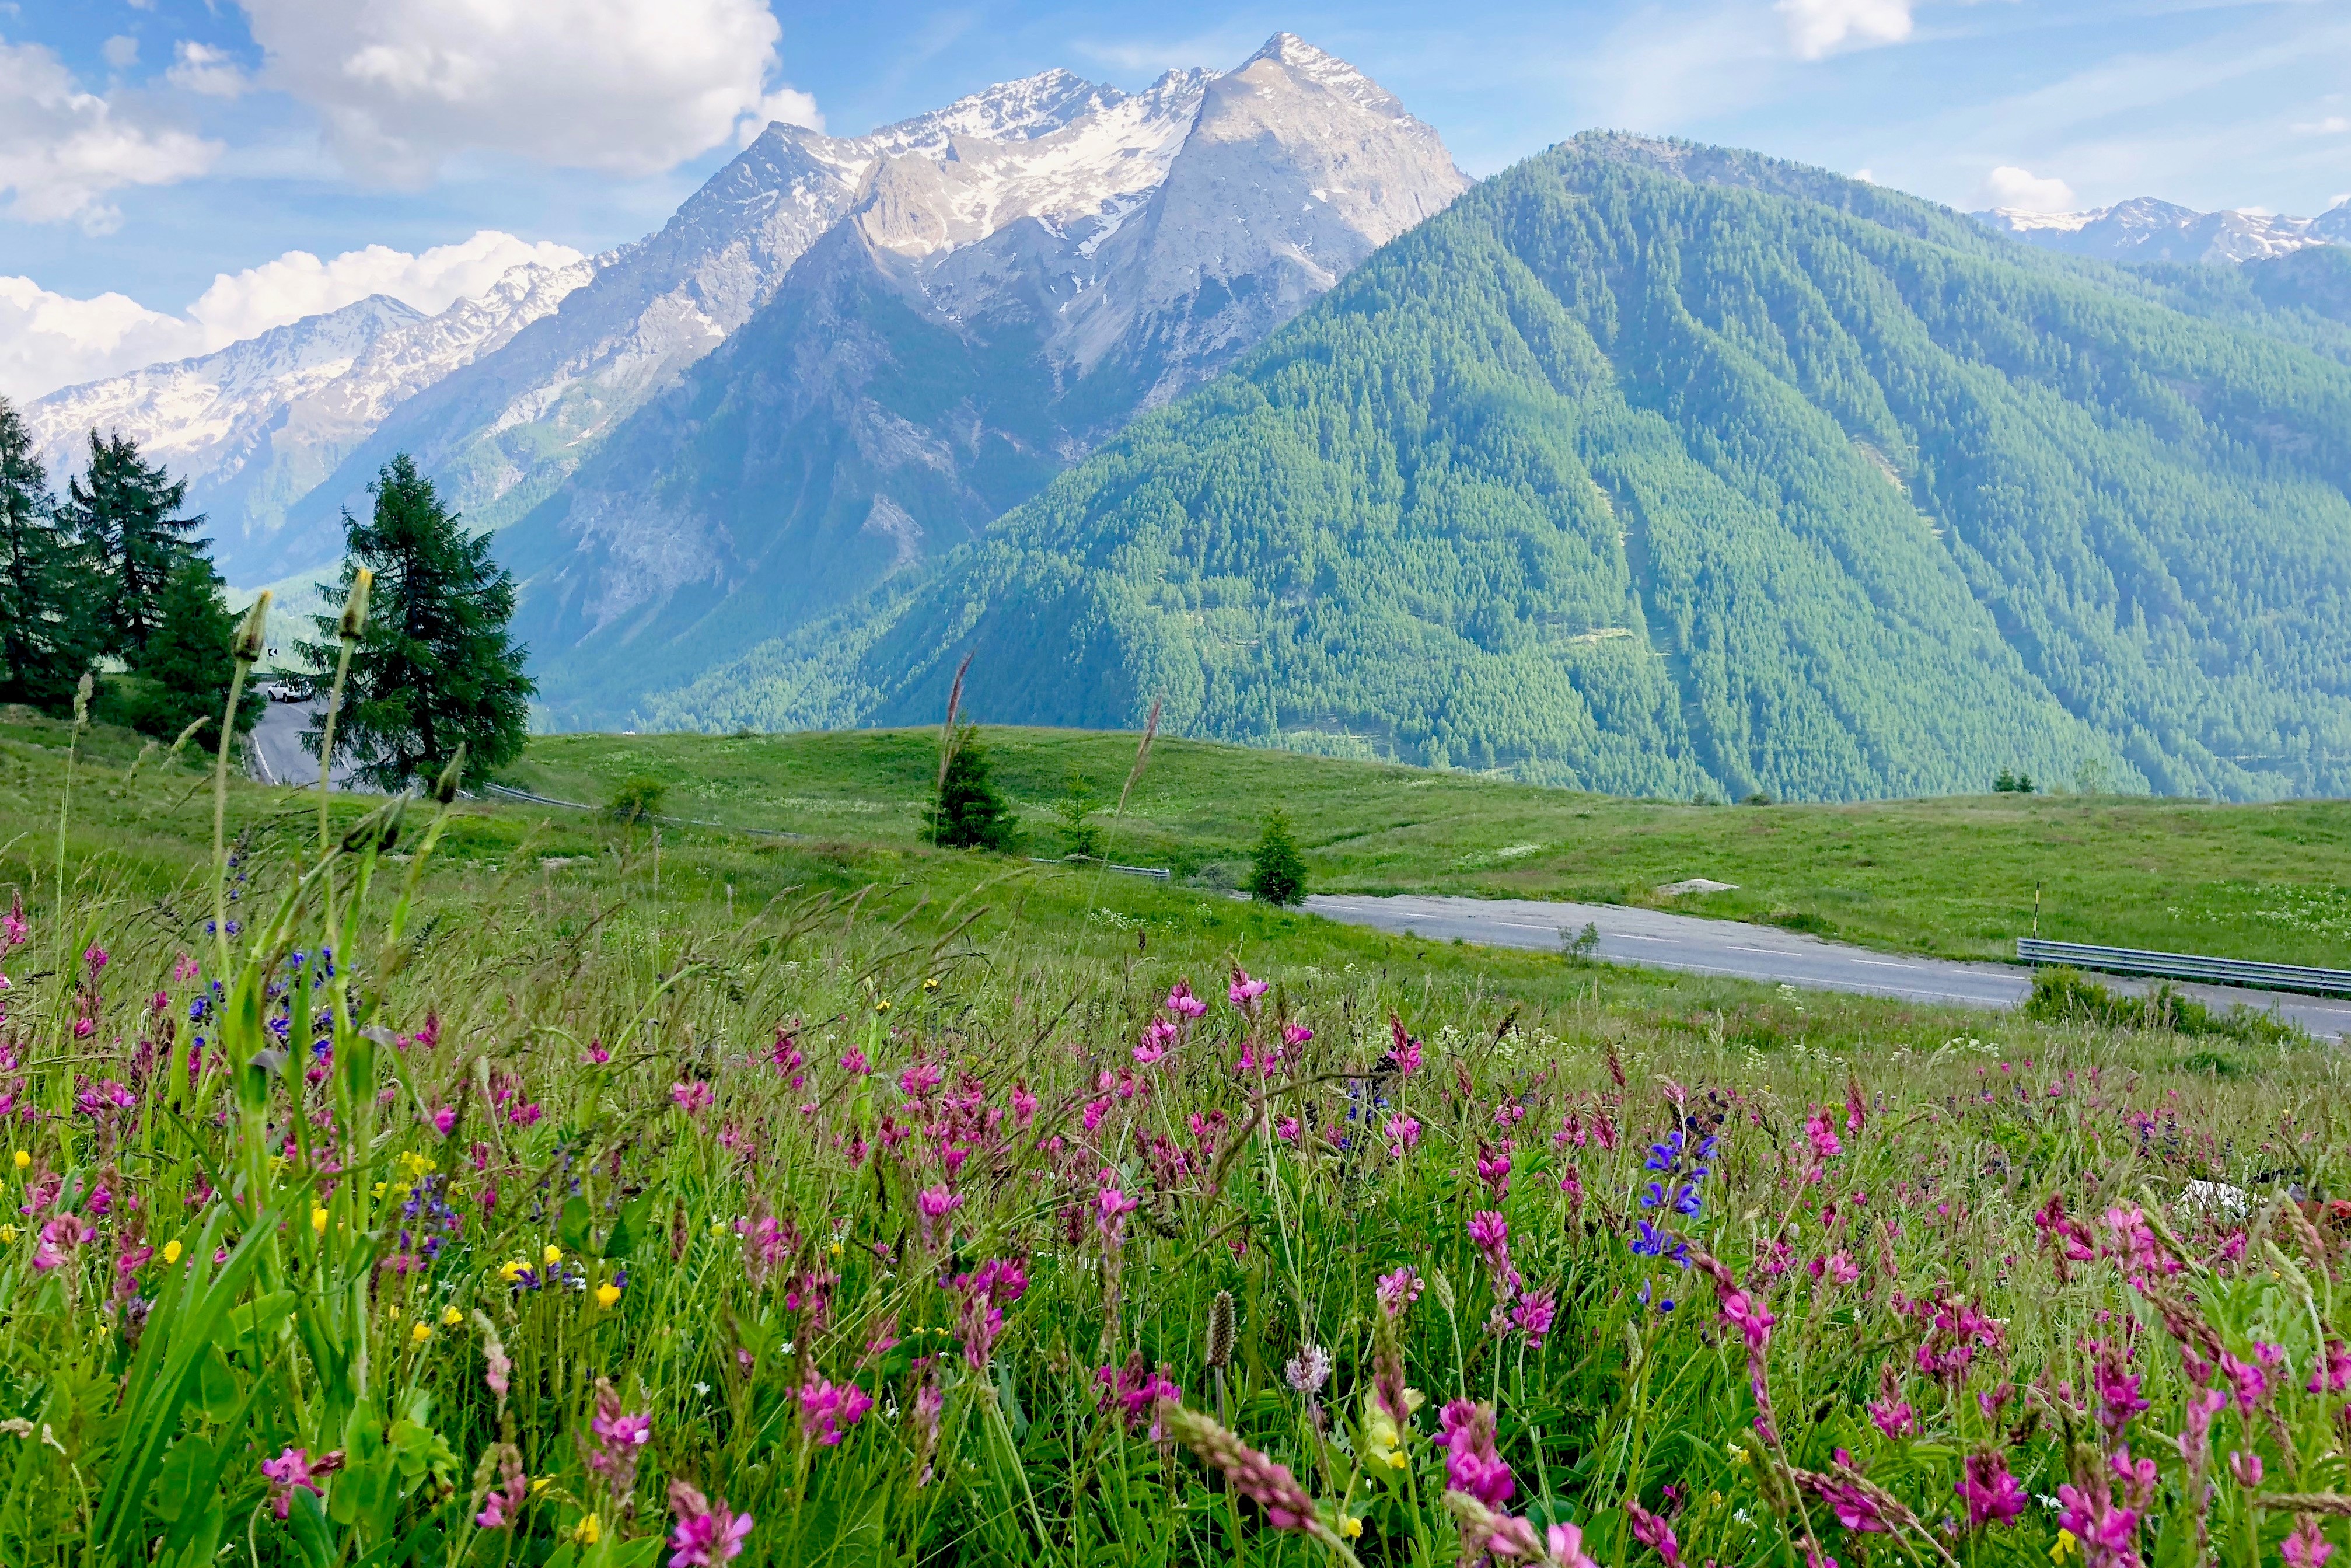
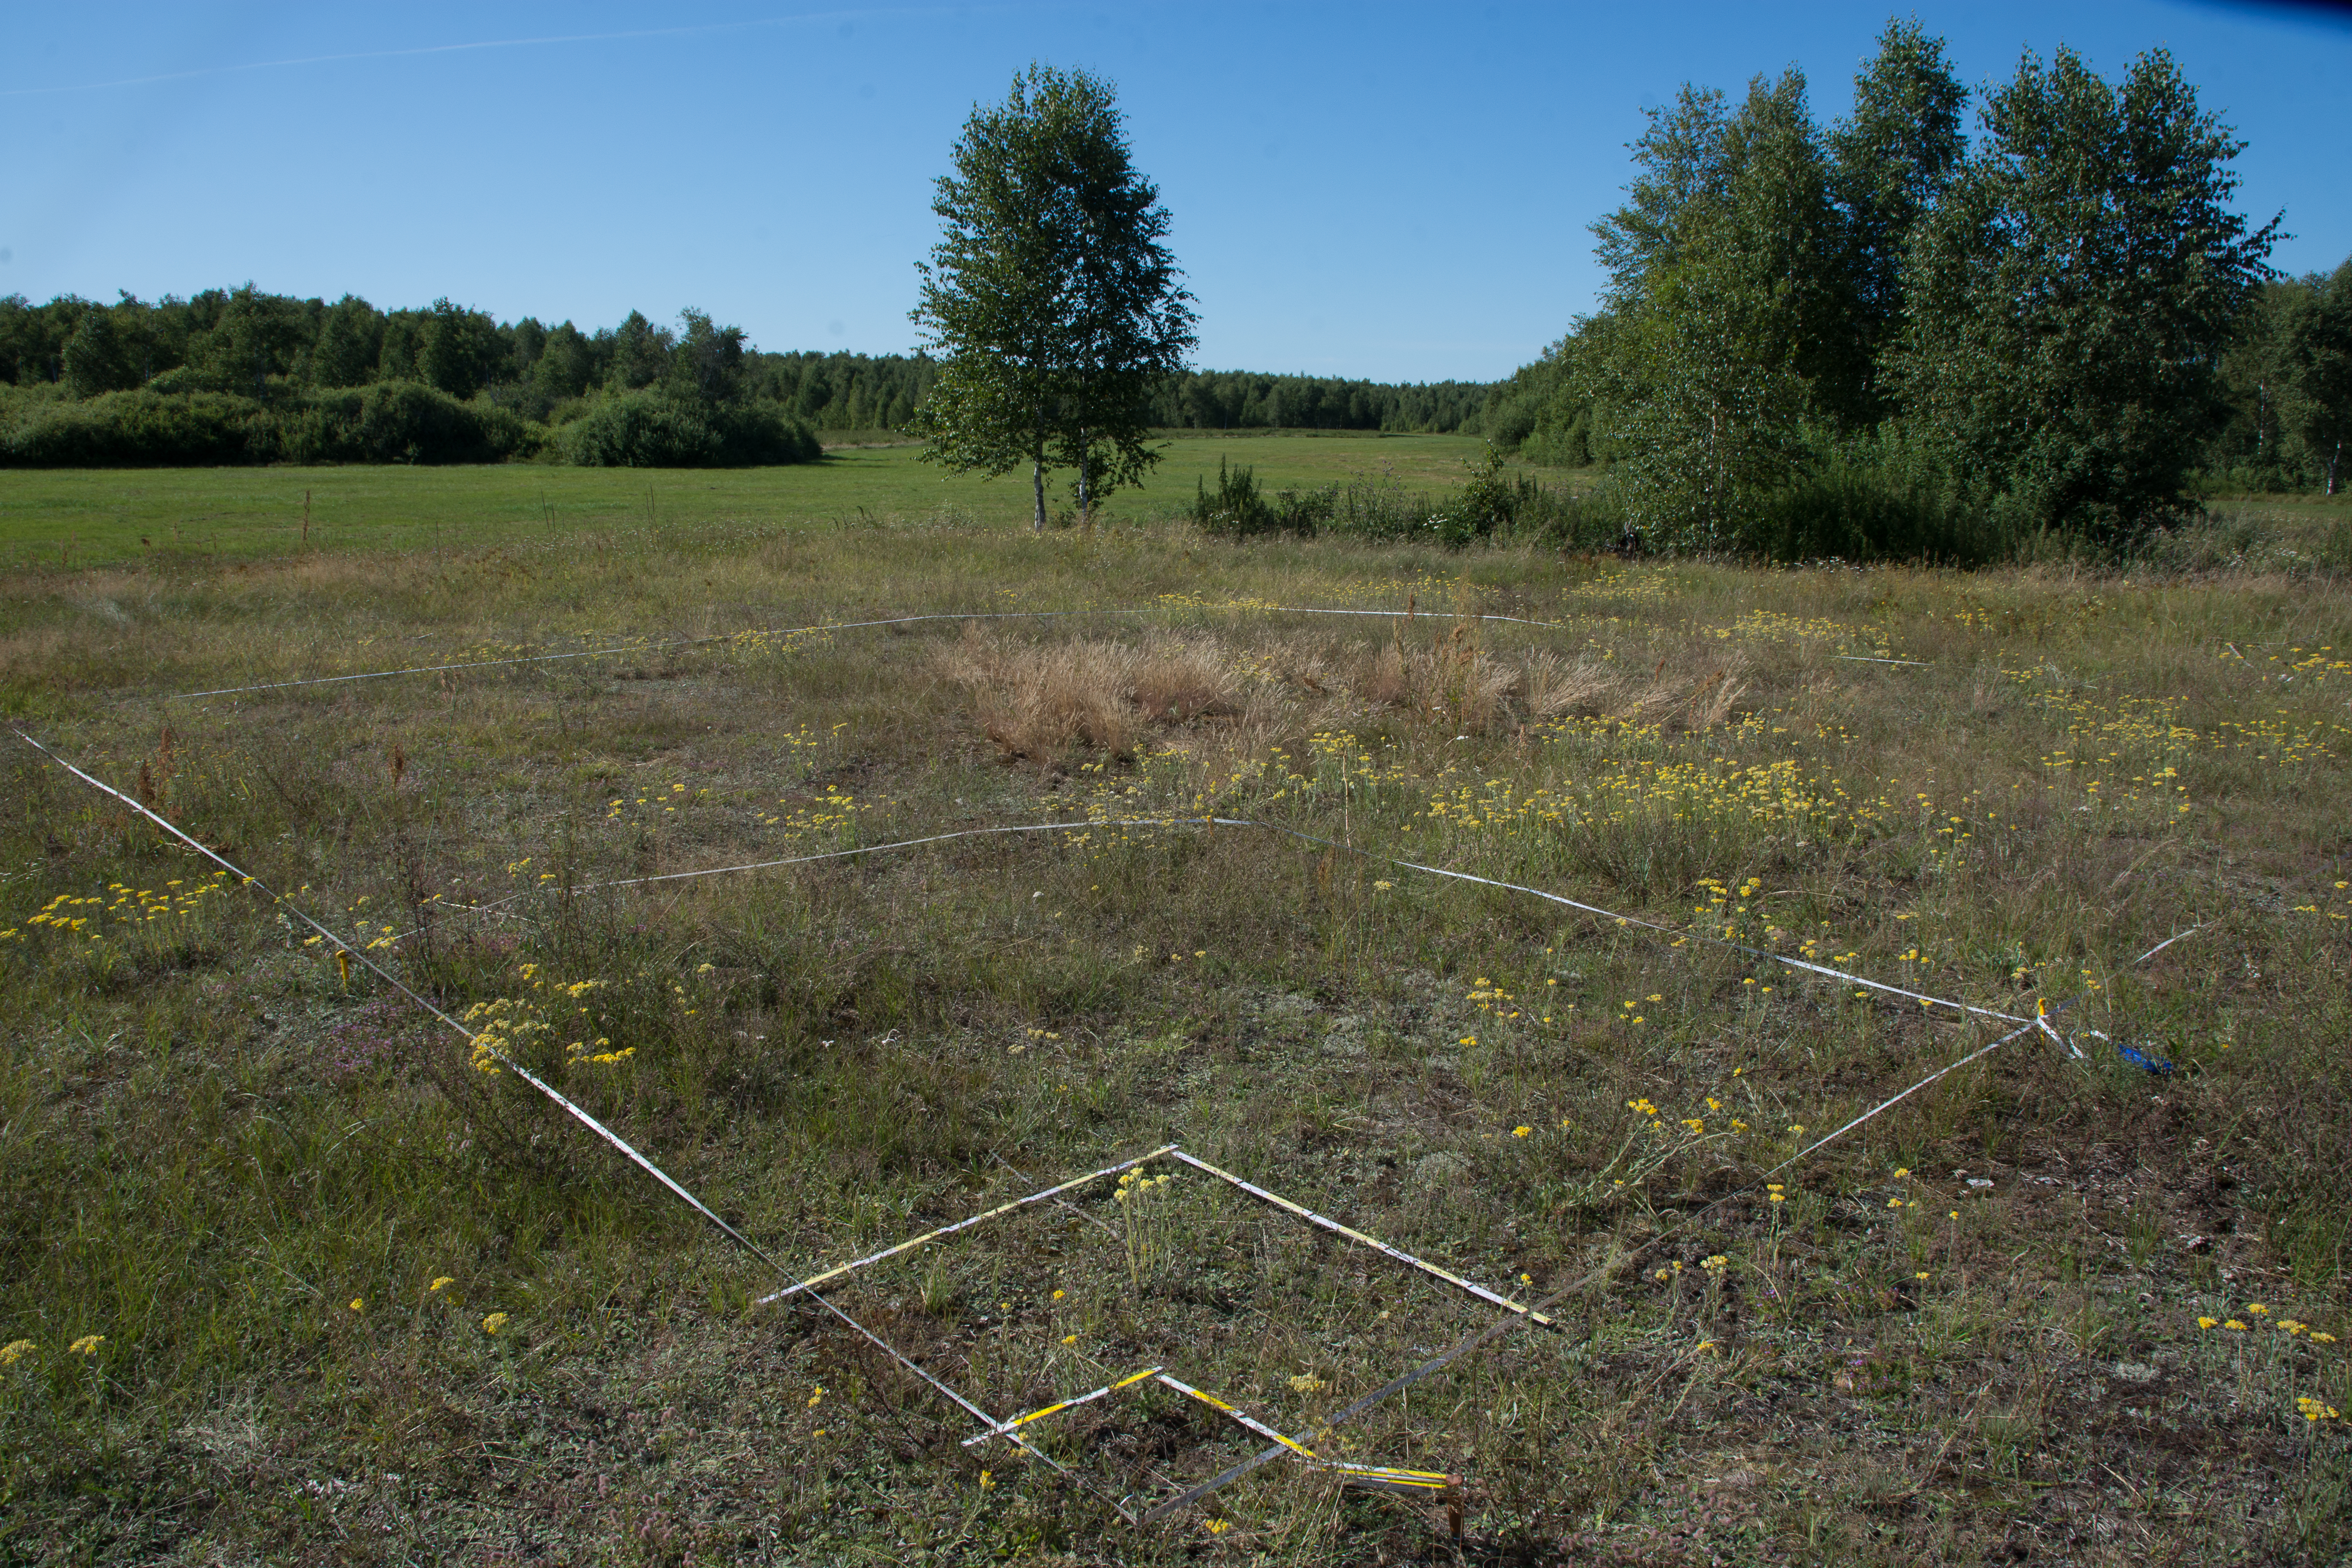
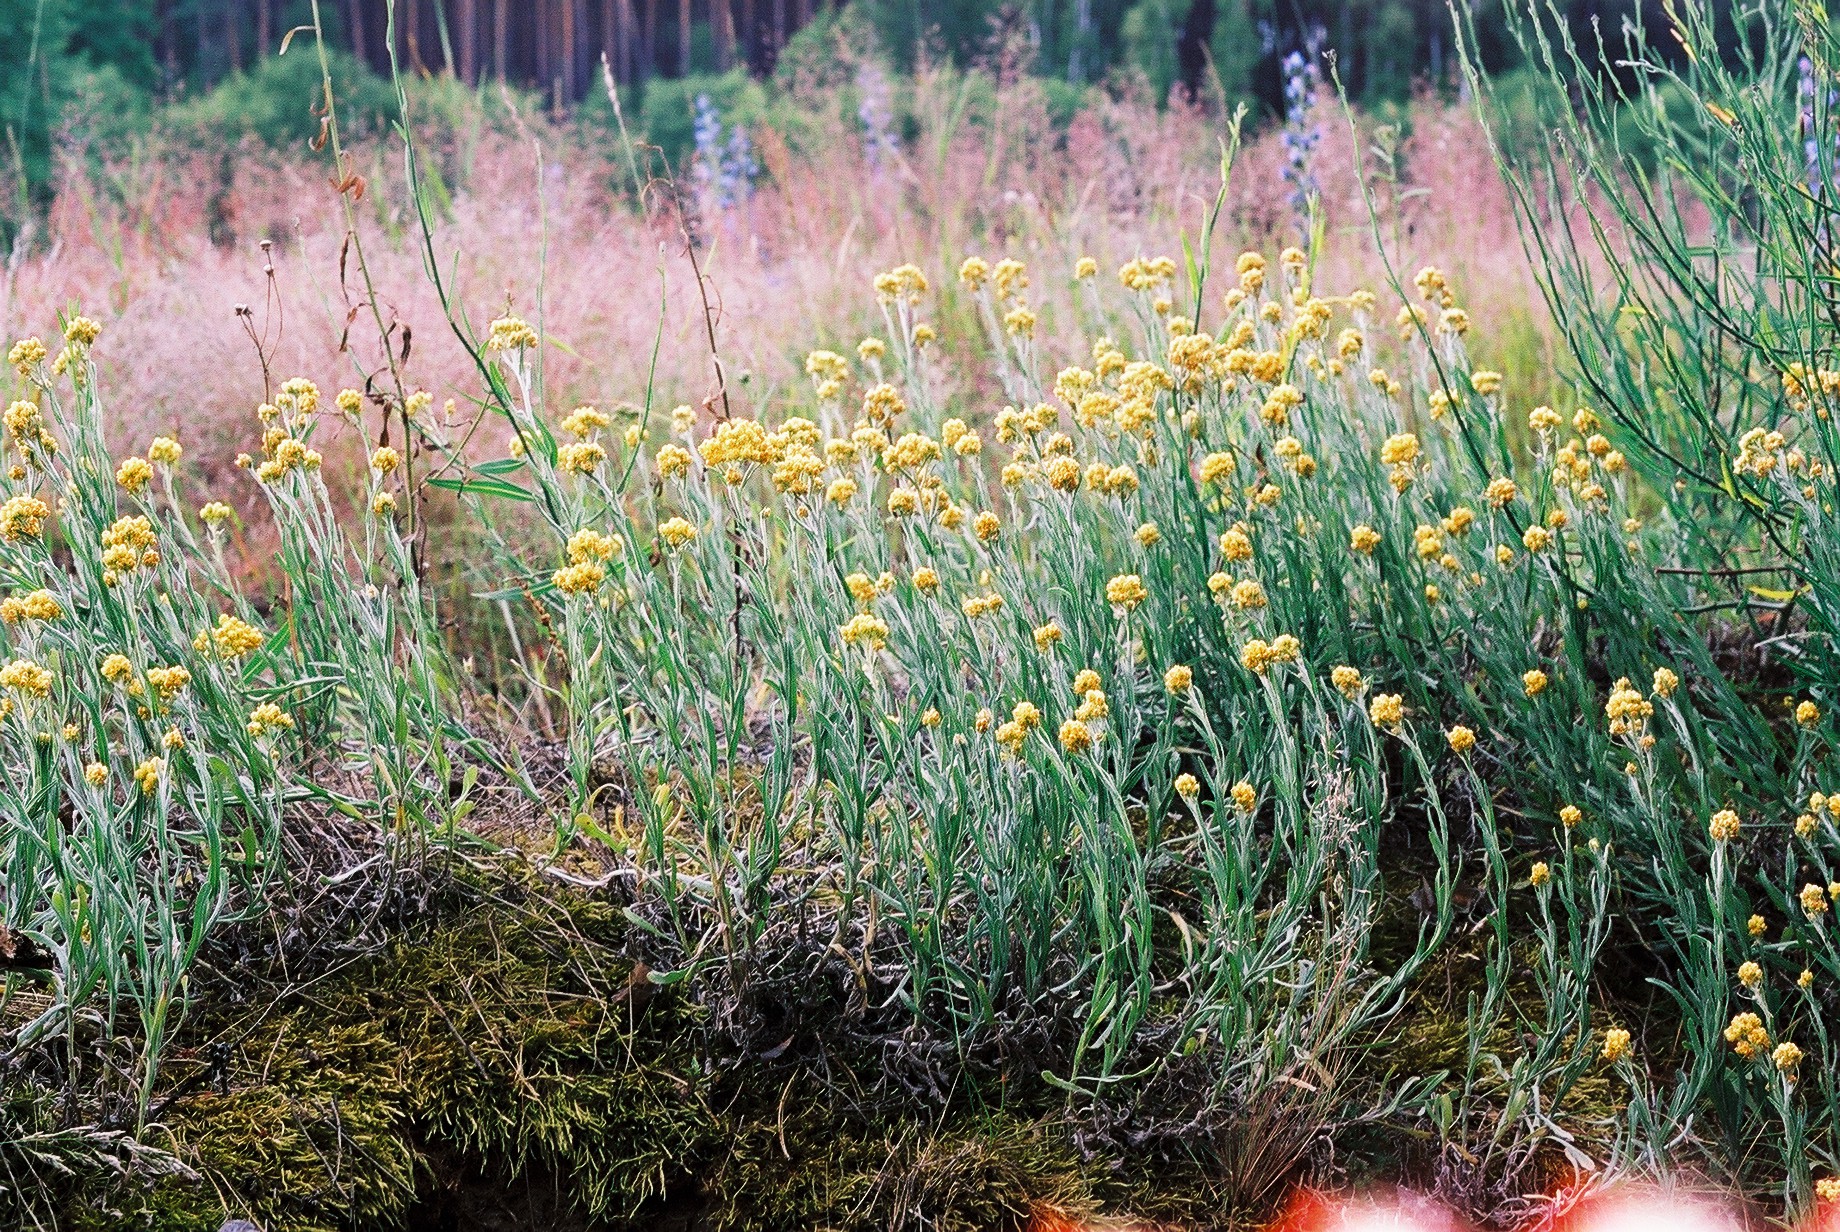
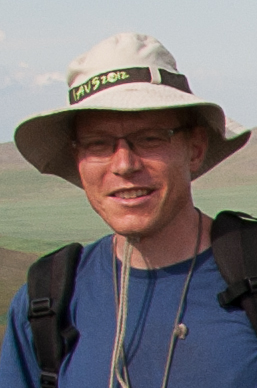
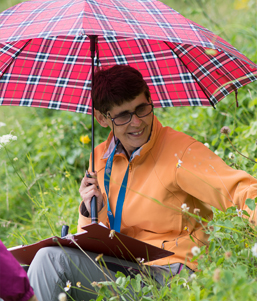
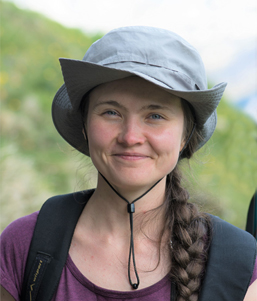
Left: A species rich pasture in Val di Susa, Northern Italy (photo: F. Napoleone). Middle: Nested-plot sampling (EDGG Biodiversity Plot) in a sandy dry grassland in NE Poland (photo: J. Dengler). Right: Flower rich sandy grassland at the roadside in western Poland (photo: R. Pielech).
GrassPlot is looking for high-quality phytodiversity data sampled on plots of the following standard areas: 0.0001 m², 0.001 or 0.0009 m², 0.01 m², 0.1 or 0.09 m², 1 m², 10 or 9 m², 100 m², and 1000 or 900 or 1024 m².
We preferentially include nested-plot multi-scale data, but we also welcome data for single grain sizes, provided they were carefully sampled with the aim of complete species lists. We request that plots have been precisely delimited in the field, usually with metal pins in the corners and a measuring tape on the perimeter, which typically is not the case for conventional phytosociological relevés. Nested-plot data with at least two different plot sizes are also accepted when plot sizes deviate from our standards.
Any type of grassland s.l. from the whole Palaearctic biogeographic realm (Europe, North Africa, West, Central and North Asia) are welcome, including dwarf-shrub communities, deserts and semi-deserts, rocks and screes, saline habitats, wetlands, dunes and ruderal communities. Aquatic and segetal vegetation are not included.
Data of vascular plants and/or terricolous non-vascular plants (bryophytes, lichens and macro-algae) can be provided. Although richness counts per plot (together with metadata, such as plot size, coordinates, grassland type) are sufficient, we encourage to provide even more valuable data with species composition and potentially cover and selected environmental data. For more details on our requirements, see here.
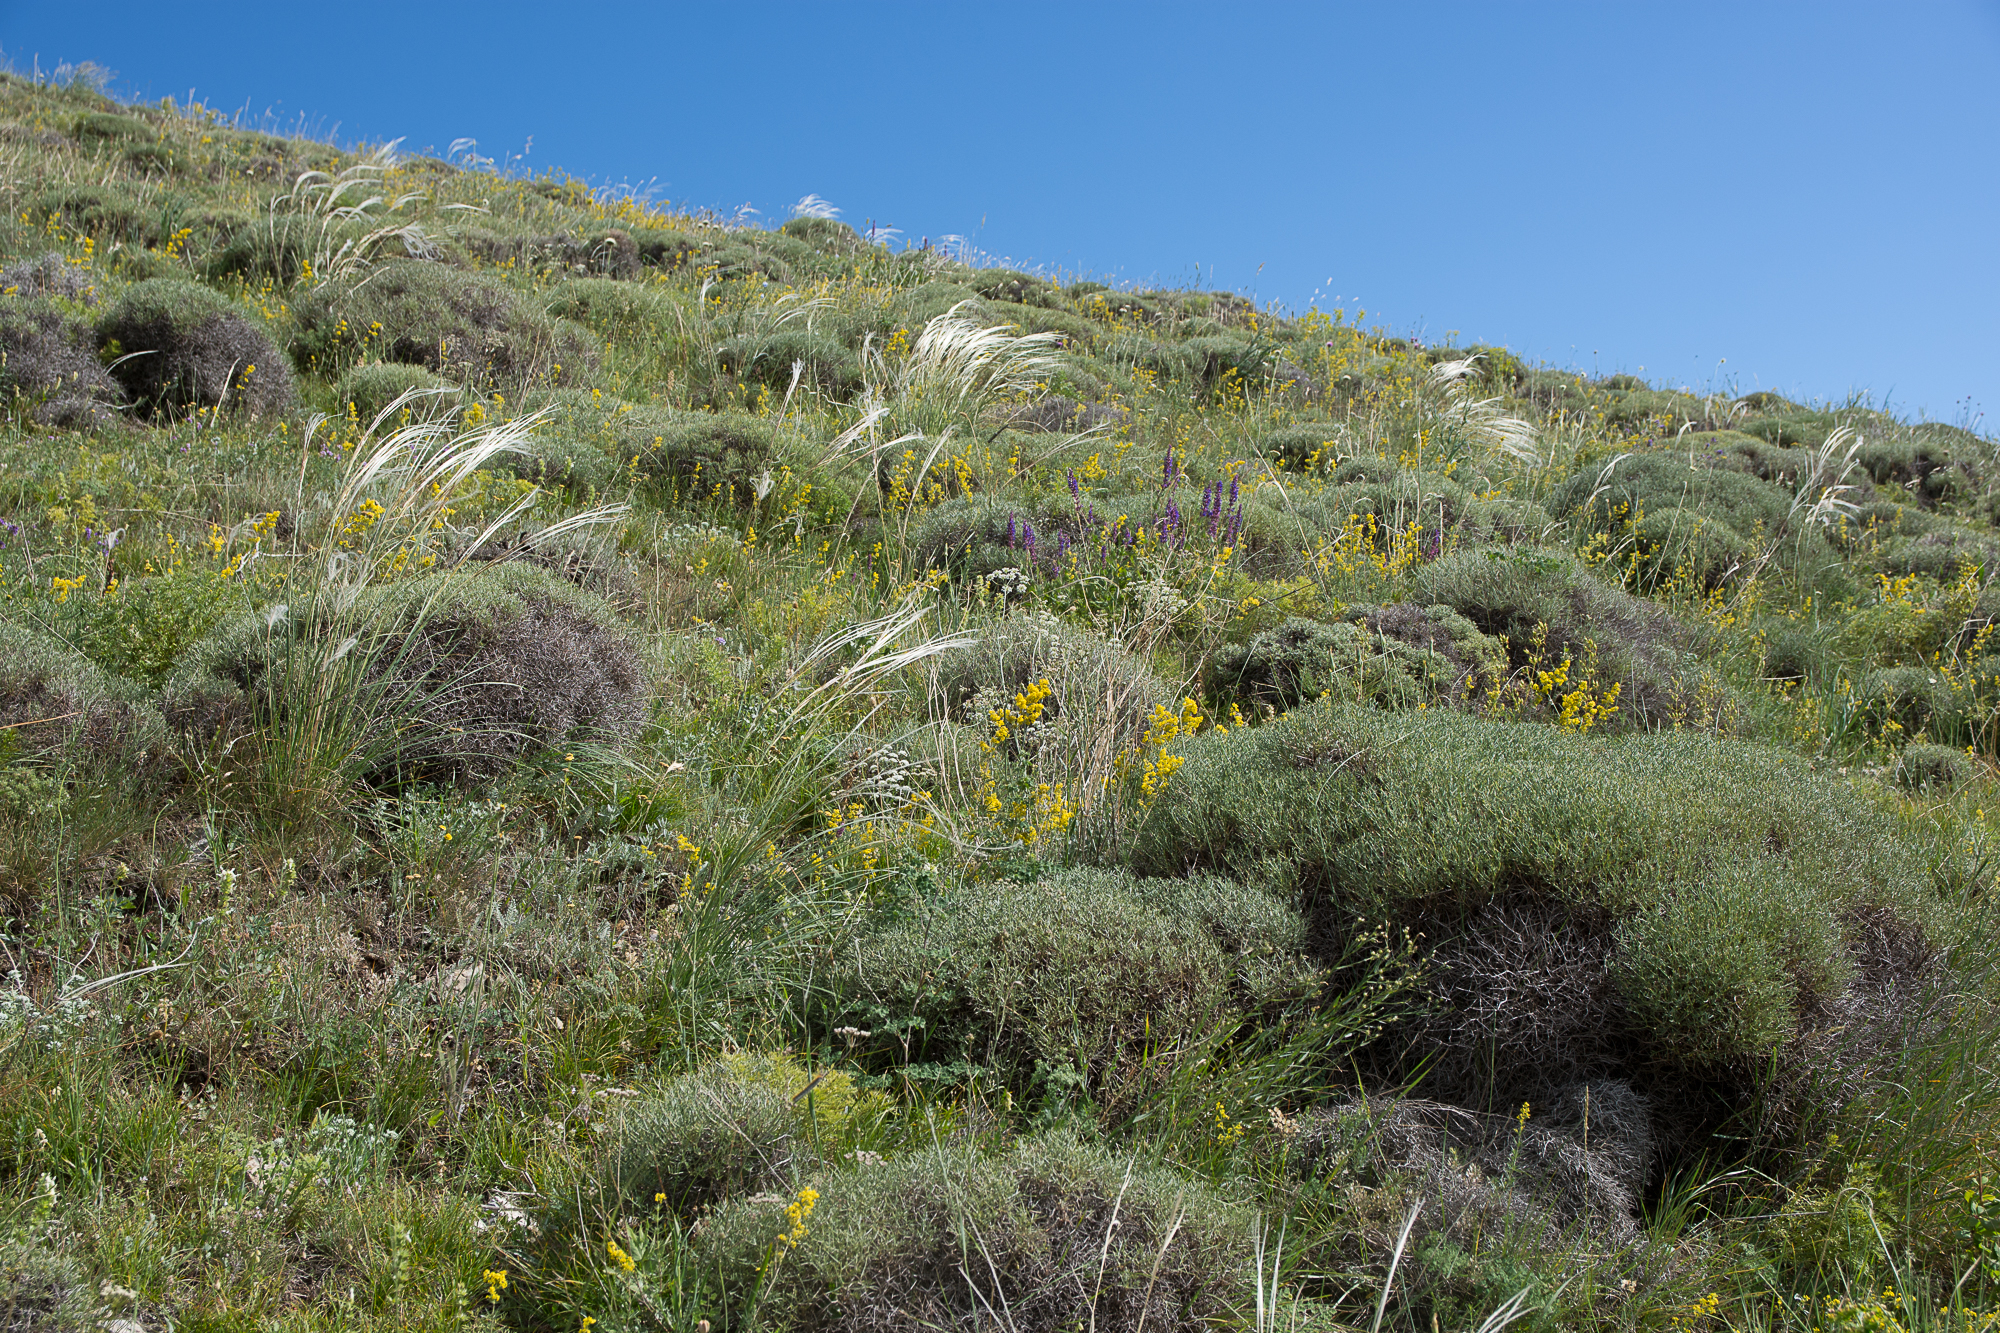
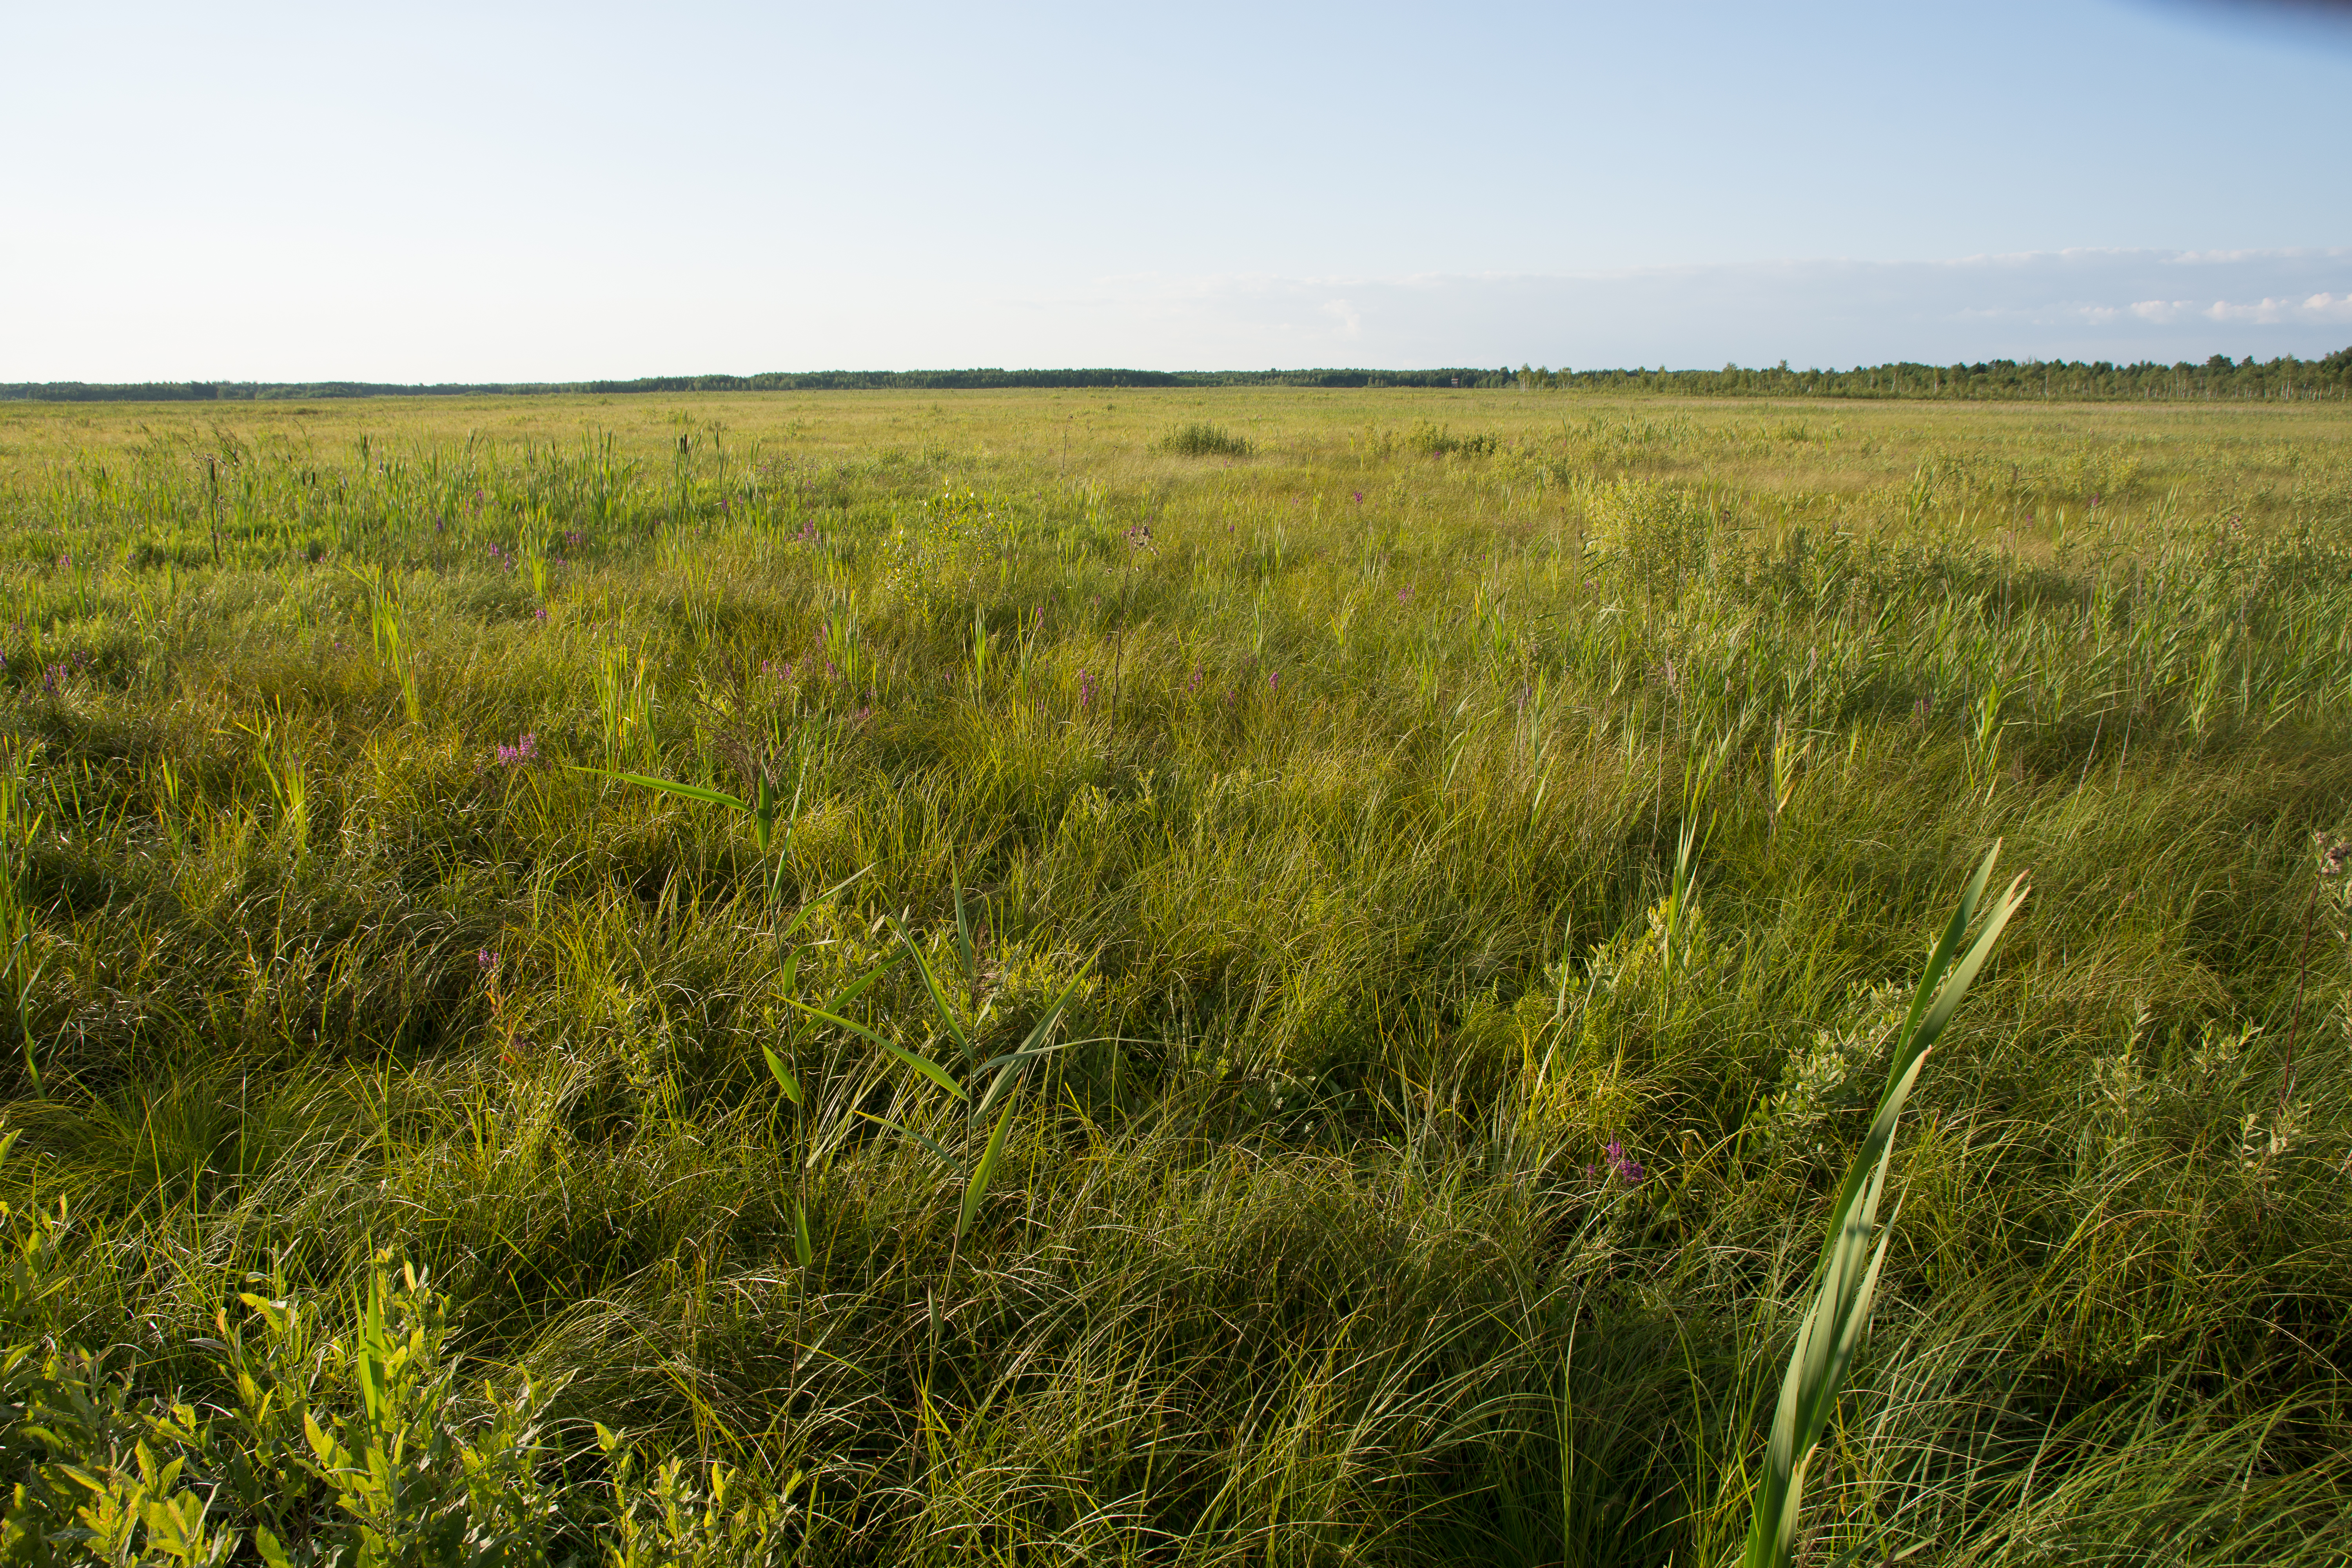
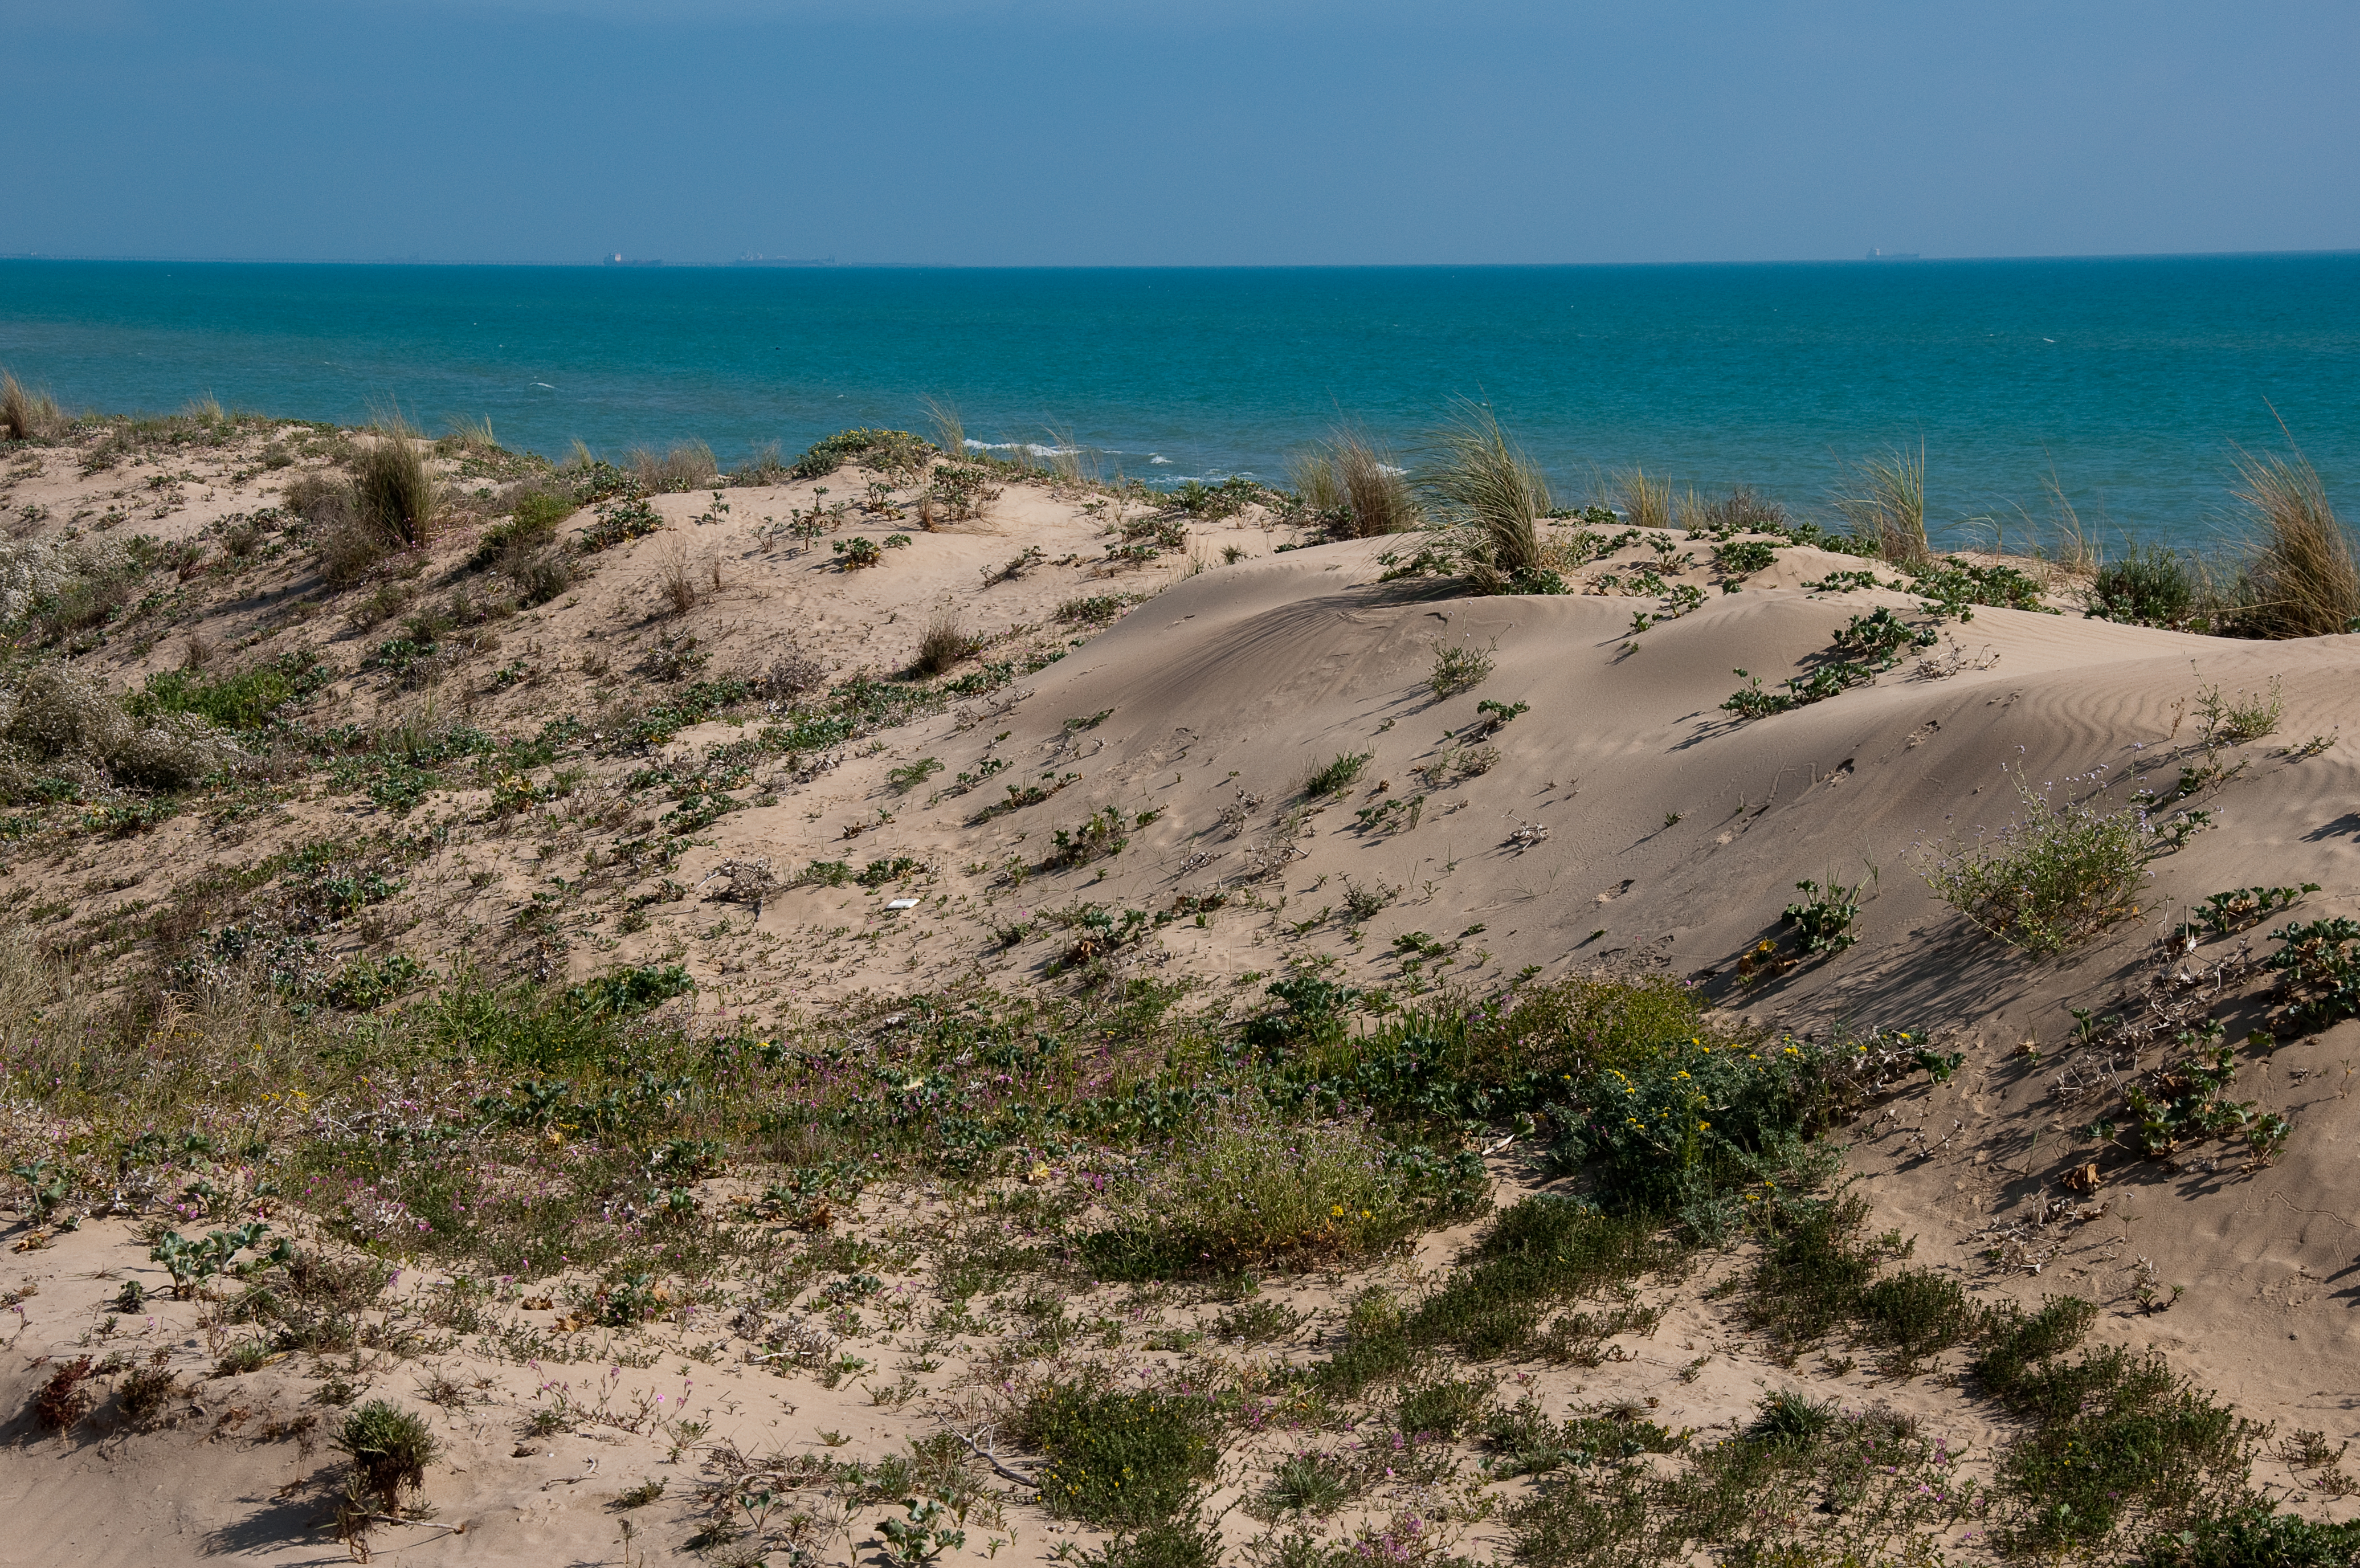
Left: Thorn-cushion steppe in Armenia. Middle: Fen vegetation in the Biebrza National Park, NE Poland. Right: Dune vegetation in Southern Sicily, Italy. Photos by J. Dengler
GrassPlot is a highly selective database for specific purposes that complements the existing "all-purpose" supranational databases European Vegetation Archive (EVA) and "sPlot", which we are collaborating with.
More details about the history and content of GrassPlot can be found here.
Join the GrassPlot Consortium
If you have data that meet the criteria mentioned above and agree with the GrassPlot Bylaws, please contact Idoia Biurrun. As member of the GrassPlot Consortium you will have the possibility to opt-in as co-author to various paper projects or to propose your own projects.
Foundation: 2010
GIVD: http://www.givd.info/ID/EU-00-003
How to use GrassPlot data
You are welcome to use data contained in the GrassPlot database for research purpose. You can apply for your paper project using the GrassPlot Paper proposal form.
Note that at least one consortium member needs to be involved in your project to be eligible. A list over all consortium members can be found in the GrassPlot database reports (Dengler et al. 2018; Biurrun et al. 2019).
Content of the GrassPlot database (state: 1 October 2020):
- 225 datasets
- 309 data owners
- 49 countries
- 202,579 plots of different grain sizes across 32,105 independent plots, among them 6,623 with data also for non-vascular plants
- 25,441 individual plots and 6,664 nested-plot series including at least two grain sizes and 5,431 with at least four grain sizes
- 2,904 0.0001-m2 plots; 4,341 0.001 (or 0.0009)-m2 plots; 70,548 0.01-m2 plots; 5,756 0.1 (or 0.09)-m2 plots; 25,432 1-m2 plots; 11,035 10 (or 9)-m2 plots; 6,321 100-m2 plots; 187 1,000 (or 900 or 1,024)-m2 plots; 76,055 non-standard plot sizes
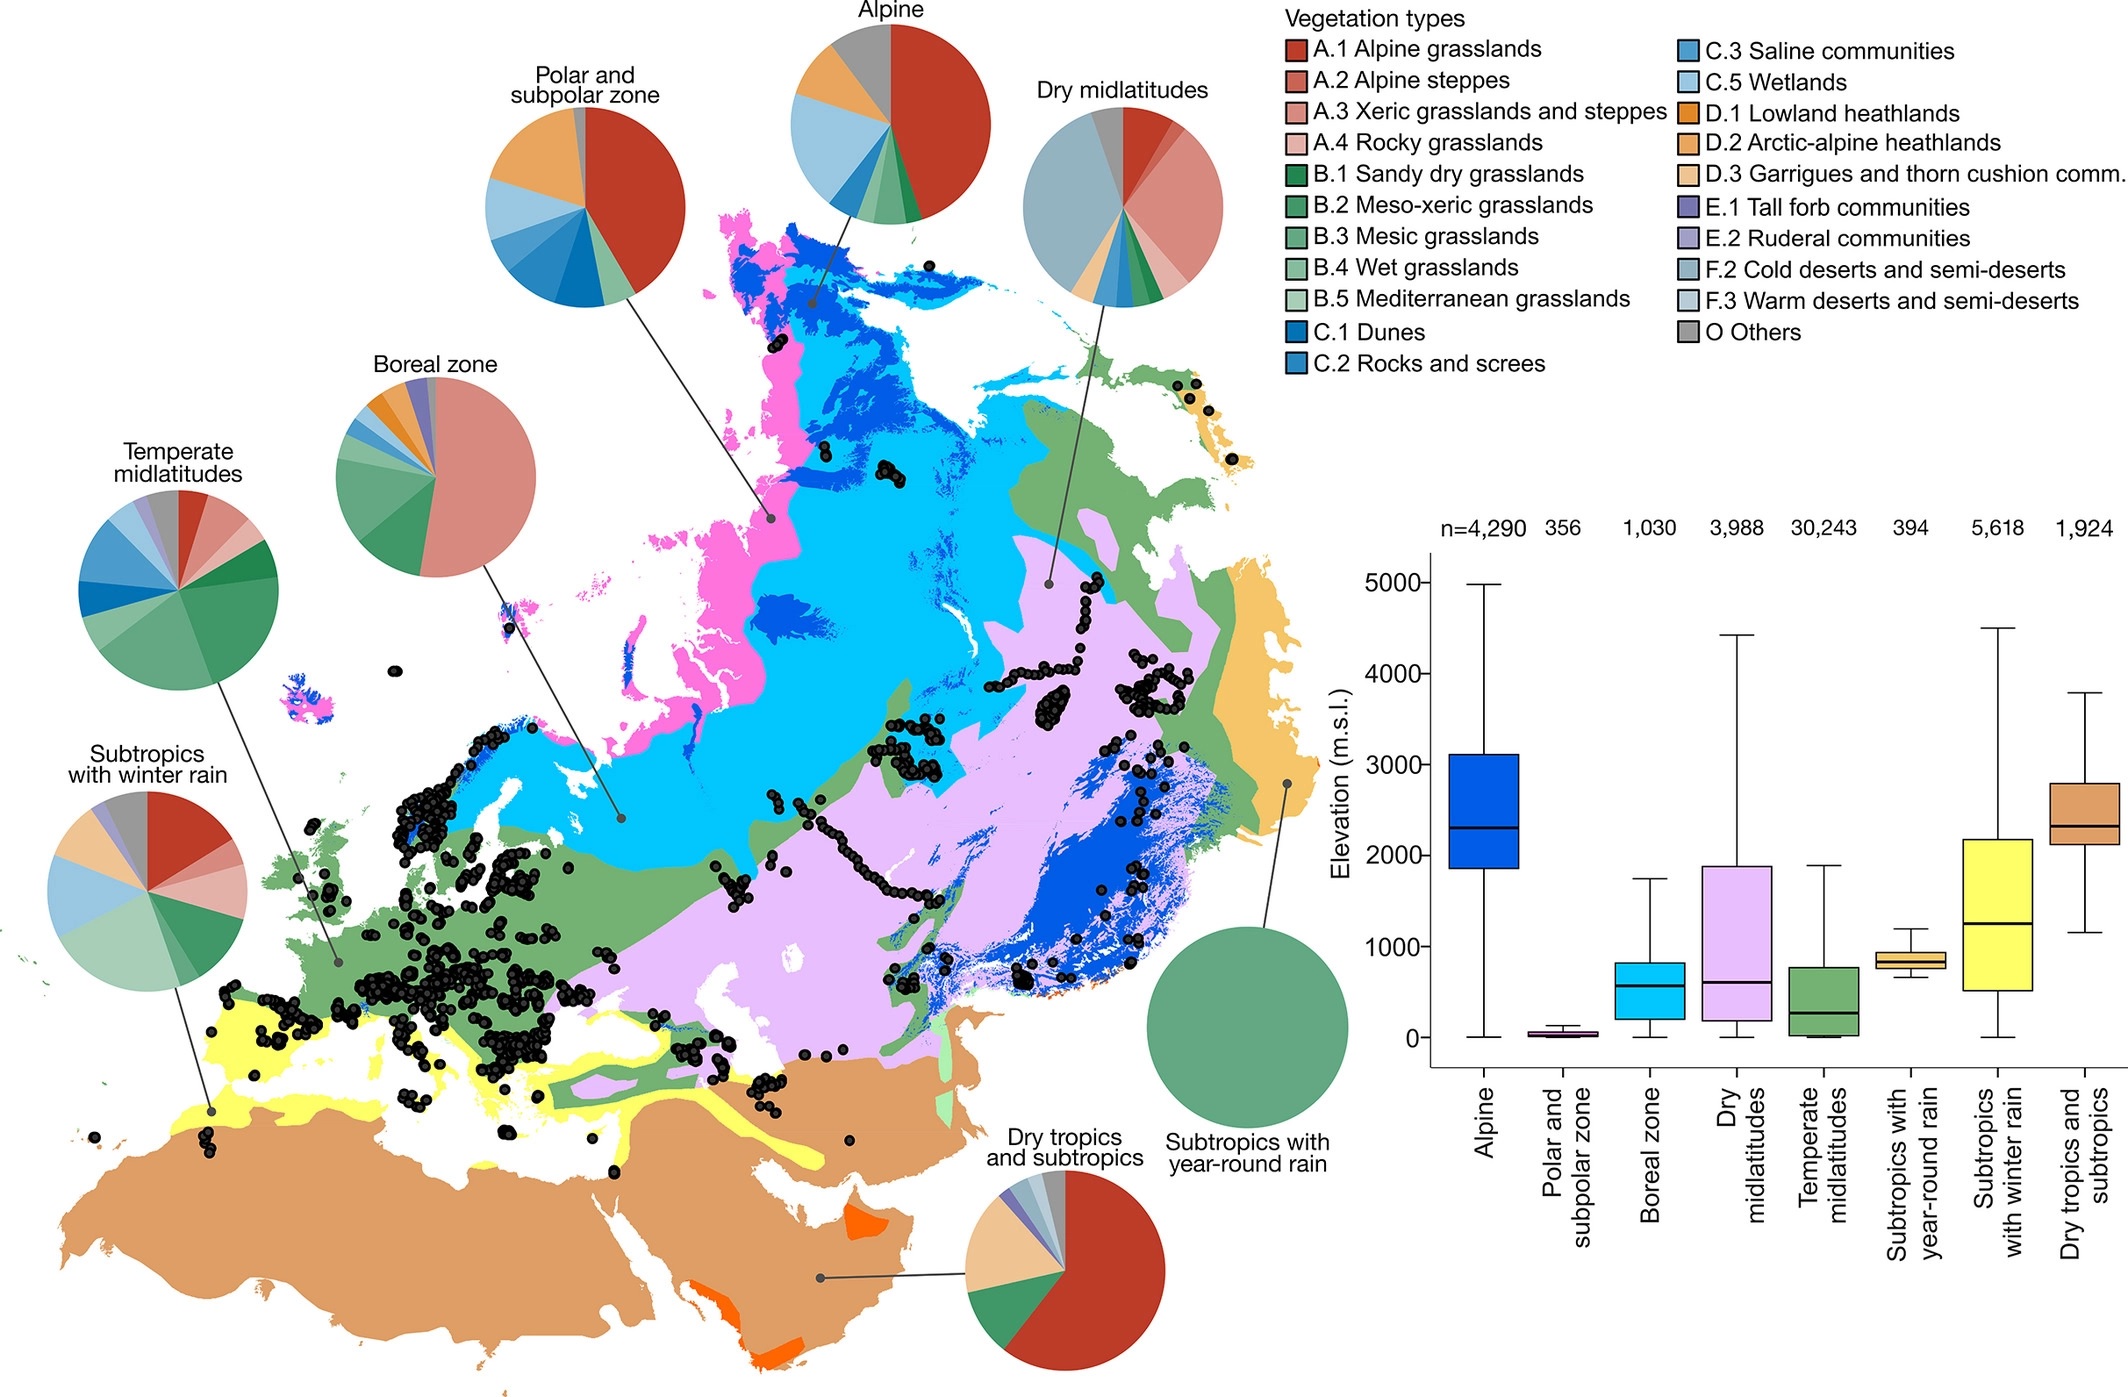
Distribution of independent plots across vegetation types
Natural grasslands: Alpine grasslands (14.1%), Xeric grasslands and steppes (8.5%), Rocky grasslands (3.3%), Alpine steppes (0.4%).
Secondary grasslands: Mesic grasslands (11.7%), Meso-xeric grasslands (16.3%), Sandy dry grasslands (4.8%), Wet grasslands (4.5%), Mediterranean grasslands (2.9%).
Azonal habitats: Saline communities (9.3%), Wetlands (8.7%), Dunes (3.0%), Saline steppes and semi-deserts (1.2%), Rocks and screes (1.2%).
Dwarf-shrublands: Arctic-alpine heathlands (1.6%), Garrigues and Thorn cushion communities (1.7%), Lowland heathlands (0.4%).
Tall forb and ruderal communities: Ruderal communities (1.5%), Tall forb and fringe communities (1.0%).
Deserts and semi-deserts: Cold deserts and semi-deserts (2.1%), Warm deserts and semi-deserts (0.1%), Alpine deserts (<0.1%).
Not assigned (1.8%).
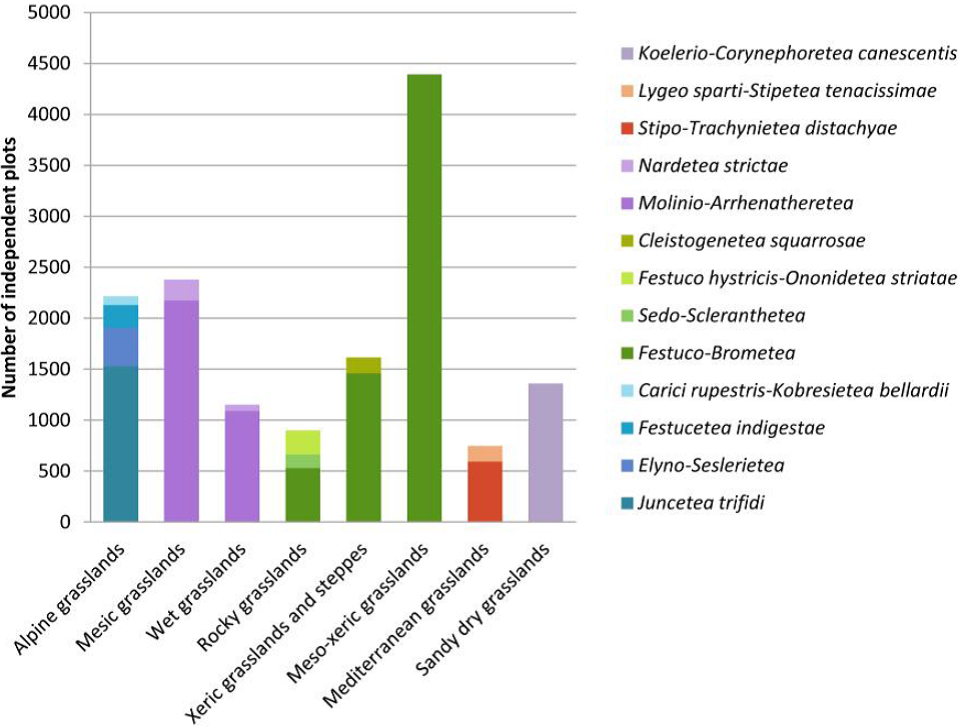
Distribution of independent plots across phytosociological classes
Festuco-Brometea (22.9%), Molinio-Arrhenatheretea (11.0%), Juncetea maritimi (6.4%), Scheuchzerio palustris-Caricetea fuscae (6.2%), Juncetea trifidi (4.9%), Koelerio-Corynephoretea canescentis (4.3%), Stipo-Trachynietea distachyae (1.9%), Helichryso-Crucianelletea maritimae (1.5%), Ammophiletea (1.3%), Elyno-Seslerietea (1.2%), Festuco-Puccinellietea (1.2%), Phragmito-Magnocaricetea (1.2%), Nardetea strictae (0.9%), Oxycocco-Sphagnetea (0.9%), Festuco hystricis-Ononidetea striatae (0.8%), Festucetea indigestae (0.7%), Cleistogenetea squarrosae (0.7%), Spartinetea maritimae (0.7%), Epilobietea angustifolii (0.5%), Lygeo sparti-Stipetea tenacissimae (0.5%), Therosalicornietea (0.5%), Sedo-Scleranthetea (0.4%), .
Other classes (3.6%).
Not assigned (25.7%).
More details about the history and content of GrassPlot can be found here.
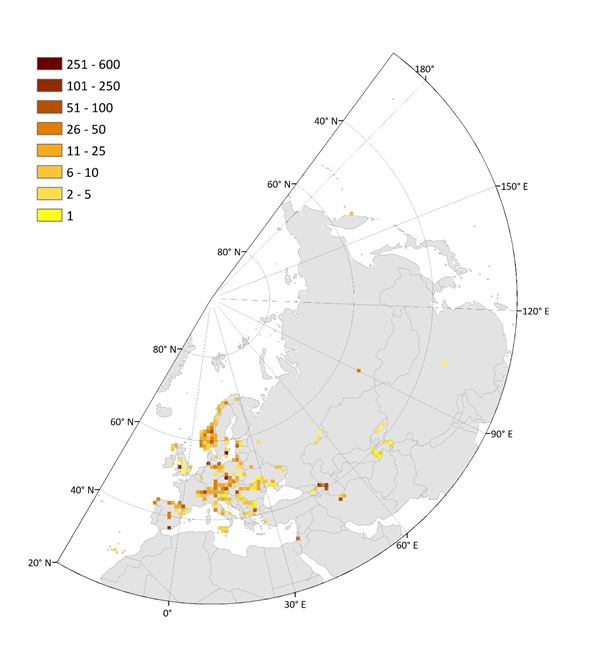
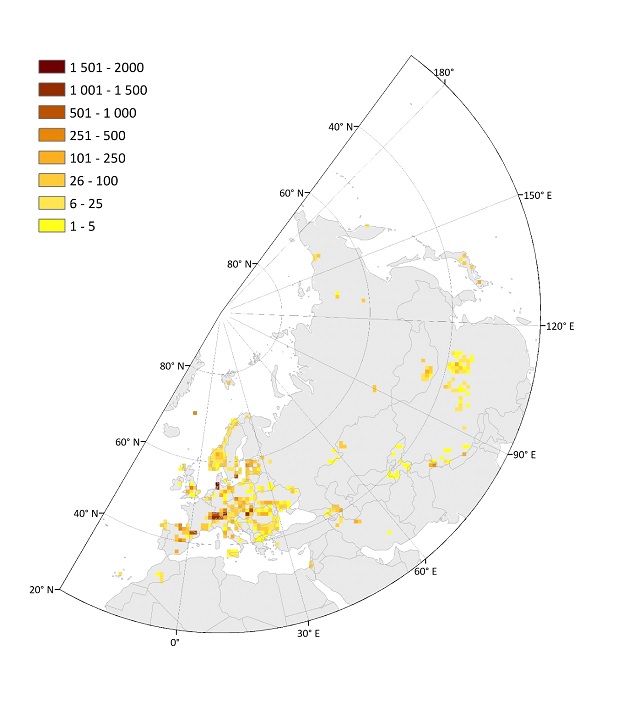
Figure: Spatial distribution of independent plots (upper) and nested plots (at least four grain sizes; lower) shown as plot density in equally-sized grid cells of 10,000 km2. From: Biurrun et al. 2019, Palaearctic Grasslands 44, 26-47
JÜRGEN DENGLER (Custodian)
Responsibilities within GrassPlot:
Outreach (including EVA and sPlot)
Newsletter
Coordination of opt-in authorships
Contact:
email: dr.juergen.dengler@gmail.com
URL: https://www.zhaw.ch/en/about-us/person/deng/
IDOIA BIURRUN (Deputy Custodian)
Responsibilities within GrassPlot:
Database manager, specifically for meta-, header and richness data
Contact person for potential data providers
Contact:
Department of Plant Biology and Ecology
University of the Basque Country
Apdo. 644
E-48080 Bilbao
Spain
email: idoia.biurrun@ehu.es
SABINA BURRASCANO
Responsibilities within GrassPlot:
Preparation and harmonization of compositional data
Contact:
P.le Aldo Moro 5
00185 Rome
Italy
email: sabina.burrascano@uniroma1.it

IWONA DEMBICZ
Responsibilities within GrassPlot:
GrassPlot Diversity Benchmarks
Handling of EDGG Field Workshop data
Contact:
Institute of Environmental Biology, Faculty of Biology,
University of Warsaw, ul. Żwirki i Wigury 101,
02-089, Warsaw
Poland
email: iwodem@op.pl
RICCARDO GUARINO
Responsibilities within GrassPlot:
Syntaxonomic assignment of plots
Contact:
email: guarinotro@hotmail.com

DENYS VYNOKUROV
Responsibilities within GrassPlot:
Management of GrassPlot webpage
Contact:
M.G. Kholodny Institute of Botany, National Academy of Sciences of Ukraine
Department of Geobotany and Ecology
01601 Kyiv
Ukraine
email: denys.vynokurov@gmail.com

REMIGIUSZ PIELECH
Responsibilities within GrassPlot:
Management of the database structure
Online platform of GrassPlot data (GrassPlot Diversity Explorer)
Contact:
Department of Forest Biodiversity, Faculty of Forestry
University of Agriculture in Kraków
Poland
email: remekpielech@gmail.com
Former members of the Governing Board 2017-2021
Viktoria Wagner (CA), Timo Conradi (DE), Alireza Naqinezhad (IR), Jutta Kapfer (NO)
Opt-in paper #24: Benchmarks of species richness in Palaearctic grassland classes
Start: 9 February 2024
Project leader(s): Jürgen Dengler, Dariia Borovyk, Remigiusz Pielech, Idoia Biurrun, Iwona Dembicz, François Gillet
Summary: The new functionality of the GrassPlot Diversity Explorer allows a fascinating comparison of nearly 50 non-forest vegetation classes with regard to their alpha diversity – based on high-quality data. Subsequent to the “benchmark paper” (#02 – Biurrun et al. 2021, Benchmarking plant diversity of Palaearctic grasslands), which explored the average richness of biomes, major vegetation types and regions, in paper #24 we plan to explore the wealth of data in GrassPlot from the phytosociological perspective, with the vegetation class as the basic unit. We will present the respective benchmarks (which are already included in the current GrassPlot Benchmarks, freely available on the GrassPlot website, but not discussed in paper #02), explore and discuss the resulting patterns. In this respect, paper #24 will be similar to #04B.2 (Dembicz et al. 2021: Fine-grain beta diversity in Palaearctic open vegetation: variability within and between biomes and vegetation types) that did something similar for fine-scale beta-diversity. We will use the GrassPlot version of early 2024, which is largely expanded compared to Biurrun et al. (2021). While being purely descriptive, we believe that this paper still will be quite useful for science.
Paper project #23: Exploring the effects of climate and land-use change on ecosystem functioning of grasslands using trait models and large ecological databases
Start: 24 October 2023
Project leader(s): Chang Liu & Koenraad Van Meerbeek
Summary: European grasslands are amongst the most species-rich ecosystems on small spatial scales. Unlike forest ecosystems, grasslands are not buffered against climate change due to the lack of canopy cover. The loss of ecosystem connectivity due to fragmentation further exacerbates the impact of climate change. In this project, we will harness the ecological big data revolution, species distribution models (SDMs), and functional traits model to explore how climate and land use change will affect the ecosystem functioning of grassland ecosystems.
First, we conducted joint species distribution models (JSDMs) on the extensive vegetation-plot database sPlot Open to project distributions of 1178 grassland species across Europe under current conditions and three future scenarios. Due to the limited number of plots and species, the environment-species relationship obtained cannot comprehensively reflect how climate and land cover changes will affect biodiversity and community composition in grassland ecosystems. Hence, we plan to extend the vegetation plot data for the following packages and depict the environment-trait relationship.
In the second step, the trait composition will be modeled at the community level as a function of environmental gradients and mapped under different scenarios. We will compare the results with those from the independent trait models (ITM), the multiple traits models (MTM), the joint traits models (JTM), and machine learning methods. In the third step, according to the inference of JSDM and JTM, the traits-environment relationship and trait-trait relationship will be comprehensively understood. The plant trait networks (PTNs) across European grassland communities and across different future scenarios will be established and visualized based on trait-trait correlation and their significance. Finally, applying the JSDM, the current and future distribution of dominant species in the Natura2000 habitat will be predicted at the community level to evaluate
whether current goals in the Natura 2000 sites are future-proof. The results will be very relevant to conservation policy.
Paper project #22: How do the combined effects of climate and land use changes shape functional and phylogenetic plant diversity across Palaearctic grasslands?
Start: 21 October 2023
Project leader(s): Maral Bashirzadeh & Alireza Naqinezhad
Summary: The project aims to assess consequences of climate change and land use and its historical legacy on shaping plant functional and phylogenetic diversity. The main objectives are to: i) assess the impacts of past and future climate change as well as land use and its historical legacy on plant functional and phylogenetic diversity and ii) monitor how a combined effect of climate and land use changes shape FD and PD in grasslands and steppe regions.
Paper project #21: Validating EIVE 1.0
Start: 13 November 2023
Project leader(s): Karlien Moeys, Koenraad Van Meerbeek & Jürgen Dengler
Summary: This project aims at testing the two new European ecological indicator value systems (Dengler et al. 2023; Tichý et al. 2023) in comparison to existing national indicator value systems via correlations of mean indicator values against measured environmental variables. GrassPlot due to its well-curated in situ measured environmental variables will be one of the main data sources of this important methodological comparison.
Paper project #20: The proper middle class: Assessing the importance of intermediate abundant species on plant community assembly and functional diversity
Start: 08 November 2023
Project leader(s): Werner Ulrich
Summary: Two basic patterns are used to describe local plant community assembly, the species abundance distribution (SAD) and the expression of species functional traits. SADs combine species richness and abundances and define the pattern of commonness and rarity in the community, while associated species – trait distributions (STD) tell about niche occupancy and environmental filters. With respect to SADs of plant communities much work has been devoted to the importance of the dominant species for community functioning, particularly productivity, biomass, and carbon sequestration. Rare species have been studied with respect to temporal variability in community composition.
Here, we try to understand the role of subordinates in plant community patterns. For this task we intend to use the GrassPlot data within the EVA data base. These data are of high resolution and make it possible to study changes in dominance orders and to relate this variability to community trait expression, functional diversity, and compositional stability. We restrict our study to the widely distributed Festuco-Brometea class (secondary dry grasslands) and intend to use at least 20 regional data sets containing a total of at least 150 single plots with a minimum of 20 species per plot. Annual average temperatures and precipitation, as well as temperature range and precipitation variability come from the high resolution European Chelsa bioclimate data. For each species we intend to extract data on five important functional traits: specific leaf area (SLA), leaf dry matter content (LDMC), plant height (HP), and seed size and numbers (SS and N).
Opt-in paper #17: RECALL – Revisiting CriticAL Loads of atmospheric nitrogen deposition
Start: 7 January 2020
Project leader(s): Tobias Ceulemans (BE), Maarten van Geel (BE) & Carly Stevens (UK)
Summary: In a recent European survey of semi-natural grasslands and in Atlantic European bogs, we found thatcommunities of arbuscular and ericoid mycorrhizal fungi showed the highest negative change at levels of atmospheric nitrogen deposition of 7 to 8 kg N ha-1 year-1 (Global Ecology and Biogeography Ceulemans et al. 2019, Ceulemans et al. in preparation). The results are remarkably consistent with the work of Sietse Van der Linde et al. (Nature 2018) in a European survey of ectomycorrhizal communities of a range of tree species that also showed negative change points at 5 to 6 kg N ha-1 year-1. Similarly, the late Richard Payne found that the critical loads for higher plant species in grasslands may be set too high (PNAS, Payne et al. 2013). These results call into question the current critical loads that are used in European environmental policy. Following the troubles in the Netherlands with wide-spread street protests of farmers against the nitrogen policy of the Kingdom, we feel it would be an excellent time to step in as scientists and revisit the critical loads with a critical eye. We already have access to datasets with hundreds of plots of bryophytes in European grasslands, mycorrhizae (orchid and arbuscular) in European grasslands (several types), heathlands and bogs (ericoid), European forests (ecto-), but we want to pull our resources. Next to additional bryophytes, higher plants and mycorrhizae; we aim to include lichens and arthropods such as butterflies. We then propose to analyse the data calculating average change points in taxon occurrence across an environmental gradient and integrates these at the community level to identify points in environmental change coinciding with maximal community change. This will allow to verify the critical loads with largescale empirical evidence across taxonomic groups and habitat types. The proposed procedure should lead to a straightforward paper to revisit (comfirm or reject) the environmental policy.
Opt-in paper #16: Components of beta-diversity across different sampling grains in Eurasian grasslands
Start: 11 February 2019
Project leader(s): Sabina Burrascano (IT) & Salza Palpurina (BG)
Summary: Sampling grain may strongly influence patterns of beta diversity. In general, it can be hypothesized that by analyzing any given dataset encompassing different grains, higher beta-diversity will be found when considering small sampling units as compared to large ones. Small sampling units, in fact, contain fewer individuals and a smaller part of the local heterogeneity and species diversity than larger ones. It is now widely accepted that beta-diversity can be partitioned into two components deriving from two different ecological processes: species replacement (also called turnover) and richness difference or nestedness (species gain and loss). Species replacement refers to the fact that species replace each other along ecological gradients, with the replacement rate being a function of gradients’ length and of the species niche breadth. Richness difference refers to the fact that one community may include a larger number of species than another. It may reflect the quantity and heterogeneity of the available resources, or differences in the species pools across the sampled communities (Baselga, 2010). Most studies addressing patterns of beta-diversity and its components in grasslands have been based on single-grain sampling units. It is therefore not known to what extent these patterns are sensitive to the grain at which the sampling is performed. Especially, it is yet to be investigated to what extent the grain-related changes in patterns of beta-diversity are driven by species replacement or richness difference. The general hypothesis would be that replacement is more relevant than richness differences at small grains as compared to larger ones and vice versa. However, this general hypothesis was never properly tested and quantitatively assessed leaving a great degree of uncertainty in the study and the interpretation of the scale-dependency of beta-diversity patterns. The aim of this study will be to examine the effect of sampling grain on patterns of beta-diversity components in grasslands across the Eurasian continent. Since the spatial extent at which the sampling is performed is likely to strongly influence the variation of replacement and richness differences across grains, we will also analyse the distance decay of these two components of beta-diversity at different spatial grains. Also the degree of environmental and structural heterogeneity is expected to strongly influence beta-diversity patterns across different spatial scales, in relation to the dominance by different species and to their response to ecological drivers operating at different spatial scales (Tuomisto et al., 2017). For this reason, components of beta-diversity across spatial grains will be investigated within and across different phytosociological classes. We will compute both the multiple-site β-diversity (i.e. variation across multiple sites), and the beta-diversity based on pairwise dissimilarities following the framework of Legendre (2014) and analyse how these differ across seven spatial grains. Pairwise dissimilarity values obtained for different spatial grains will be modeled against spatial distances in order to investigate also the effect of spatial extent. Analyses will be run within and across major phytosociological classes.
Paper project #04D
Project leaders(s): François Gillet (FR), Sándor Bartha (HU), Renaud Jaunatre (FR), Jinghui Zhang (CN) and Jürgen Dengler (CH)
Summary: This paper is not a GrassPlot paper s.str. as it does not use GrassPlot data, but it has been inspired by the work on GrassPlot papers #04A, #04B and particularly #04C. These papers together suggest that overall fine-grain species-area relationships follow a power law unexpectedly well (i.e. no scale-dependence in z-values), while more rarely there is a peak of local z vs. log (grain size), usually below 1 m². Paper project #04D will be a simulation study to explore under which conditions we get a constant z and under which conditions we get unimodal relationships of local z vs. log (grain size). We will vary such parameters as granularity of the environment, frequency distribution and spatial aggregation patterns of species. This paper is planned as a co-production of François Gillet, Sanyi Bartha, Renaud Jaunatre, Jinghui Zhang and Jürgen Dengler, normally without opt-in procedure (as no GrassPlot data are used). However if someone has good ideas and specific competences he or she can contact the first author (francois.gillet@univ-fcomte.fr) to discuss options to join the author team.
Opt-in project #03: How do environmental factors shape the diversity of vascular plants, bryophytes and lichens in Palaearctic grasslands at multiple scales?
Start: 11 February 2020
Project leader(s): Iwona Dembicz (PL) & Jürgen Dengler (CH)
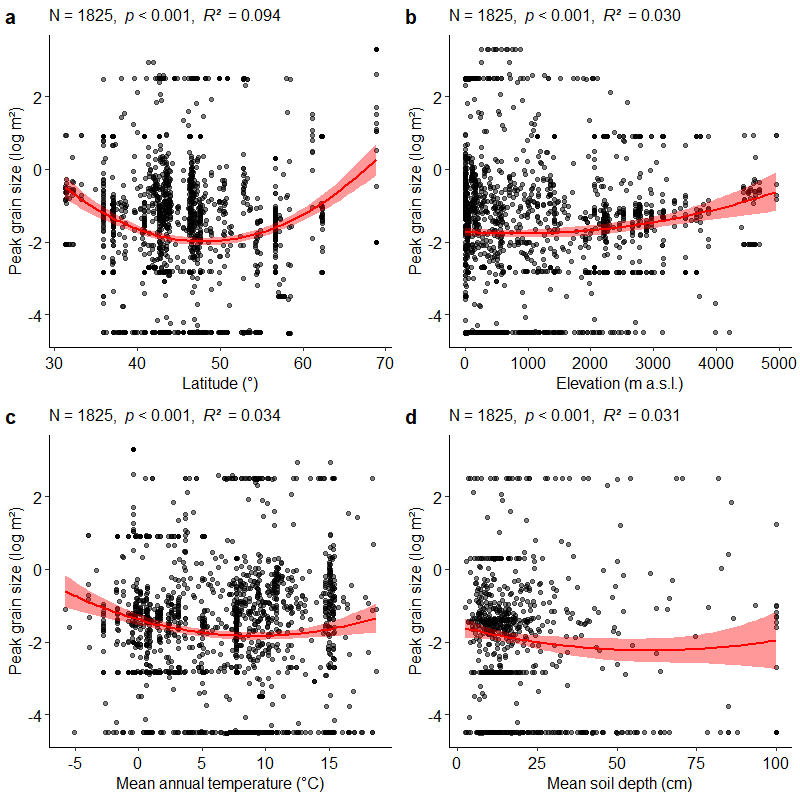
Summary: Understanding the factors governing alpha diversity patterns is a central theme in ecology and biogeography. However, results from regional studies are often not consistent, which can be attributed to idiosyncrasies of the regions and to the fact that different studies analysed different grain sizes as their alpha diversity, while a strong scale dependence of drivers of alpha diversity is generally acknowledged. Here we want to derive a general model that describes alpha-diversity in Palaearctic grasslands s.l. We aim to overcome the idiosyncrasies of previous studies by (a) combining many different regions and grassland types and (b) conducting our analyses with nested-plot data for different grain sizes simultaneously. Moreover, compared to previous regional studies with member datasets of GrassPlot (e.g. Löbel et al. 2006, Turtureanu et al. 2014, Kuzemko et al. 2016, Polyakova et al. 2016), we will include not only the local environmental variables (topography, soil, land use) and climate, but also parameters related to landscape configuration (amount of grassland in the surrounding, heterogeneity of the landscape), history (human impact, glaciations,…) and possibly species pool. Our results will be beneficial both from the point of view of basic ecological knowledge (advancing the understanding how drivers of biodiversity interact across spatial scales) and for practical conservation (e.g., identification of plant biodiversity hotspots; identification of human-related disturbance levels most benefiting biodiversity). Among others, we hope that our resulting model will be able to explain why a few small regions of the Palaearctic grasslands have such an extraordinary small-scale richness (“world record holders”) compared to other similar grasslands in other regions, and possibly predict other, not yet known such hotspots (which then could be sampled).
In the analyses, we will use nested-plot series with richness data of vascular plants, bryophytes and lichens. The richness data of each selected grain size will be used as response variables and a wide range of topographic, climatic, edaphic, anthropogenic and historical parameters (taken from GrassPlot and from other databases) as explanatory variables in our models (e.g. generalized linear mixed models and/or boosted regression trees). The importance of particular predictors will be assessed with multimodel inference or other similar approach. Details of the modelling approach (e.g. how to account for the spatial and ecological clustering at multiple scales) will be discussed with the approved co-authors.
Opt-out papers #01A, #01B: “Database papers”
Start: March 2017
Project leader(s): Jürgen Dengler (CH) & Idoia Biurrun (ES)
Summary: The GrassPlot Consortium published an initial paper that the describes the scope and the content of the database in 2018. When there are major updates, we are publishing follow-ups of this database paper.
Publications:
Dengler, J., Wagner, V., Dembicz, I., García-Mijangos, I., Naqinezhad, A., Boch, S., Chiarucci, A., Conradi, T., Filibeck, G., (…) & Biurrun, I. 2018. GrassPlot – a database of multi-scale plant diversity in Palaearctic grasslands. Phytocoenologia 48: 331–347. [www.doi.org/10.1127/phyto/2018/0267]
Biurrun, I., Burrascano, S., Dembicz, I., Guarino, R., Kapfer, J., Pielech, R., Garcia-Mijangos, I., Wagner, V., Palpurina, S., (…) & Dengler, J. 2019. GrassPlot v. 2.00 – first update on the database of multi-scale plant diversity in Palaearctic grasslands. Palaearctic Grasslands 44: 26-47. [pdf]
Opt-in paper #04A: “Species-area relationships”
Start: January 2019
Project leader: Jürgen Dengler (CH)
Summary: Patterns and drivers of small-scale beta-diversity in Palaearctic grasslands
Publication:
Dengler, J., Matthews, T.J., Steinbauer, M.J., Wolfrum, S., Boch, S., Chiaruzzi, Al, Conradi, T., Dembicz, I., Marcenò, C., (…) & Biurrun, I. 2020. Species-area relationships in continuous vegetation: Evidence from Palaearctic grasslands. Journal of Biogeography 47: 72-86. [pdf] [supplements]
https://vegsciblog.org/2021/07/07/new-insights-into-small-scale-species-area-relationships/
Opt-in paper #04C: How do environmental factors shape the scale dependence of local z-values in Palaearctic grasslands?
Start: 11 February 2020
Project leader(s): Jinghui Zhang (CH & CN) & Jürgen Dengler (CH)
Summary: Species-area relationships (SARs) are fundamental for understanding biodiversity patterns and are generally well described by a power law with a constant exponent z. However, z-values sometimes vary across spatial scales. We asked whether there is a general scale dependence of z-values at fine spatial grains and which potential drivers influence it.
Publication:
Zhang, J., Gillet, F., Bartha, S., Alatalo, J.M., Biurrun, I., Dembicz, I., Grytnes, J.-A., Jaunatre, R., Pielech, R., Van Meerbeek, K., Vynokurov, D., Widmer, S., Aleksanyan, A., Bhatta, K.B., Campos, J.A., Czortek, P., Dolezal, J., Essl, F., García-Mijangos, I., Guarino, R., Güler, B., Hájek, M., Kuzemko, A., Li, F.Y., Löbel, S., Moradi, H., Naqinezhad, A., Silva, V., Šmerdová, E., Sonkoly, J., Stifter, S., Talebi, A., Török, P., White, H., Wu, J. & Dengler, J. 2021. Scale dependence of species-area relationships is widespread but generally weak in Palaearctic grasslands. Journal of Vegetation Science 32: e13044.
https://onlinelibrary.wiley.com/doi/10.1111/jvs.13044
https://vegsciblog.org/2021/07/07/new-insights-into-small-scale-species-area-relationships/
Opt-in papers #04B: Fine-grain beta diversity of Palaearctic grassland vegetation
Start: 20 January 2019
Project leader(s): Jürgen Dengler (CH/DE) & Iwona Dembicz (PL/CH)
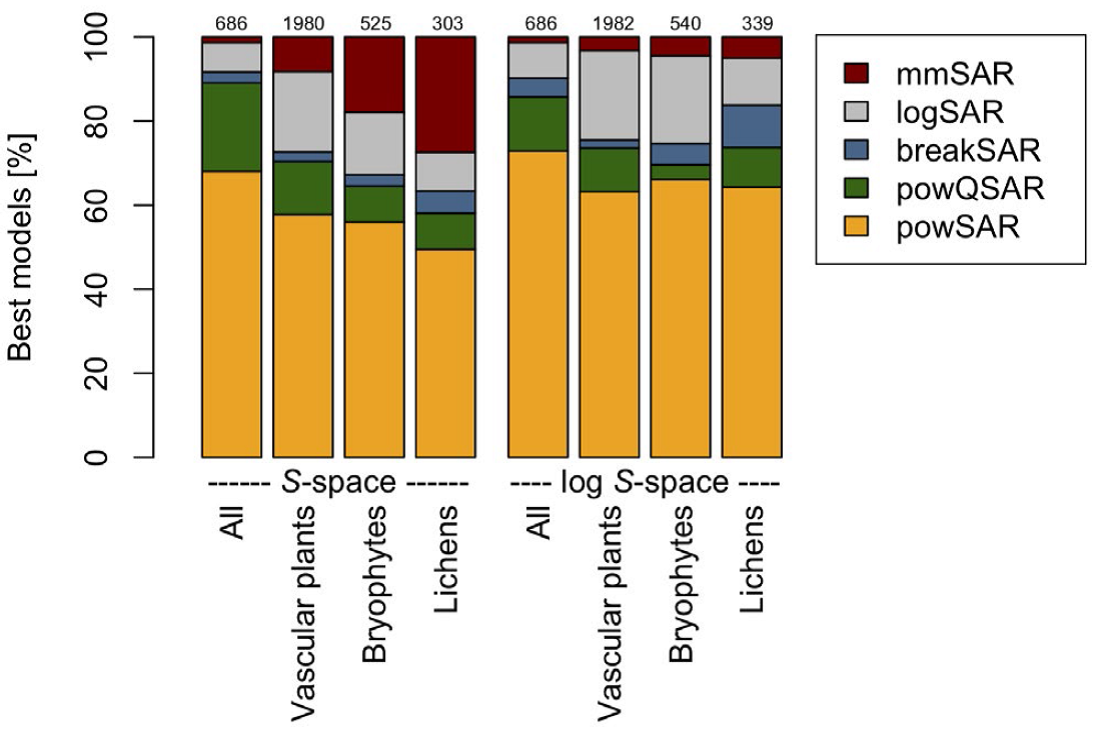
Summary: In Dengler et al. 2019, we demonstrated that in Palaearctic grasslands the power function is generally by far the best model to describe species-area relationships (SARs) in continuous vegetation at grain sizes up to 1000 m². Based on this finding and the general notion that the exponent of the power function SARs (z-value) is an appropriate measure of standardized multiplicative beta-diversity, we conducted an extensive study on the relationship of z-values to a wide array of factors based on more than 4500 nested plot series.
Publication:
Dembicz, I., Dengler, J., Steinbauer, M.J., Matthews, T.J., Bartha, S., Burrascano, S., Chiarucci, A., Filibeck, G., Gillet, F., Janišová, M., Palpurina, S., Storch, D., Ulrich, W., Aćić , S., Boch, S., Campos, J.A., Cancellieri, L., Carboni, M., Ciaschetti, G., Conradi, T., De Frenne, P., Dolezal, J., Dolnik, C., Essl, F., Fantinato, E., García-Mijangos, I., Giusso del Galdo, G.P., Grytnes, J.-A., Guarino, R., Güler, B., Kapfer, J., Klichowska, E., Kozub, Ł ., Kuzemko, A., Löbel, S., Manthey, M., Marcenò, C., Mimet, A., Naqinezhad, A., Noroozi, J., Nowak, A., Pauli, H., Peet, R.K., Pellissier, V., Pielech, R., Terzi, M., Ugurlu, E., Valkó, O., Vasheniak, I., Vassilev, K., Vynokurov, D., White, H.J., Willner, W., Winkler, M., Wolfrum, S., Zhang, J. & Biurrun, I. 2021. Fine-grain beta diversity of Palaearctic grassland vegetation. Journal of Vegetation Science 32: e13045.
https://onlinelibrary.wiley.com/doi/10.1111/jvs.13045
https://vegsciblog.org/2021/07/07/new-insights-into-small-scale-species-area-relationships/
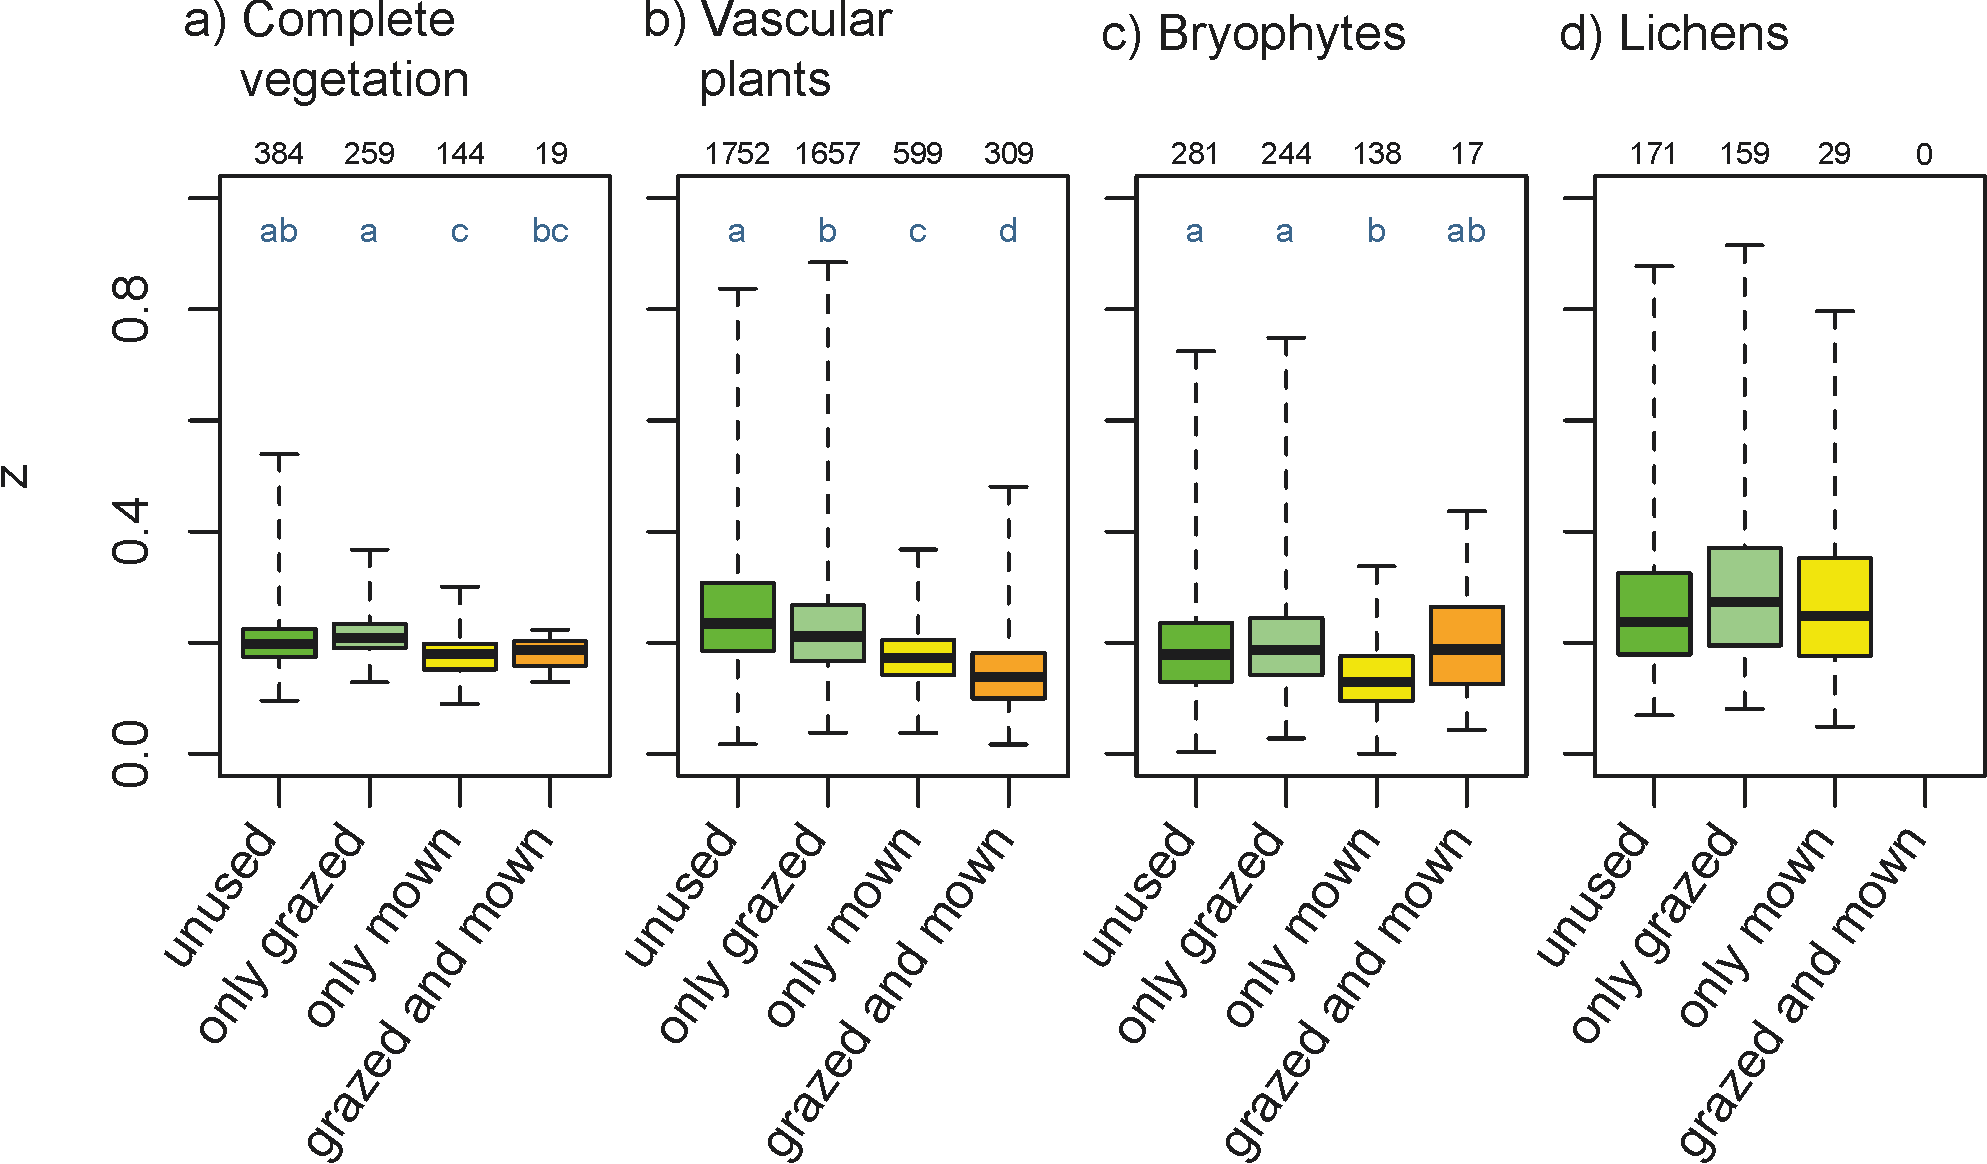
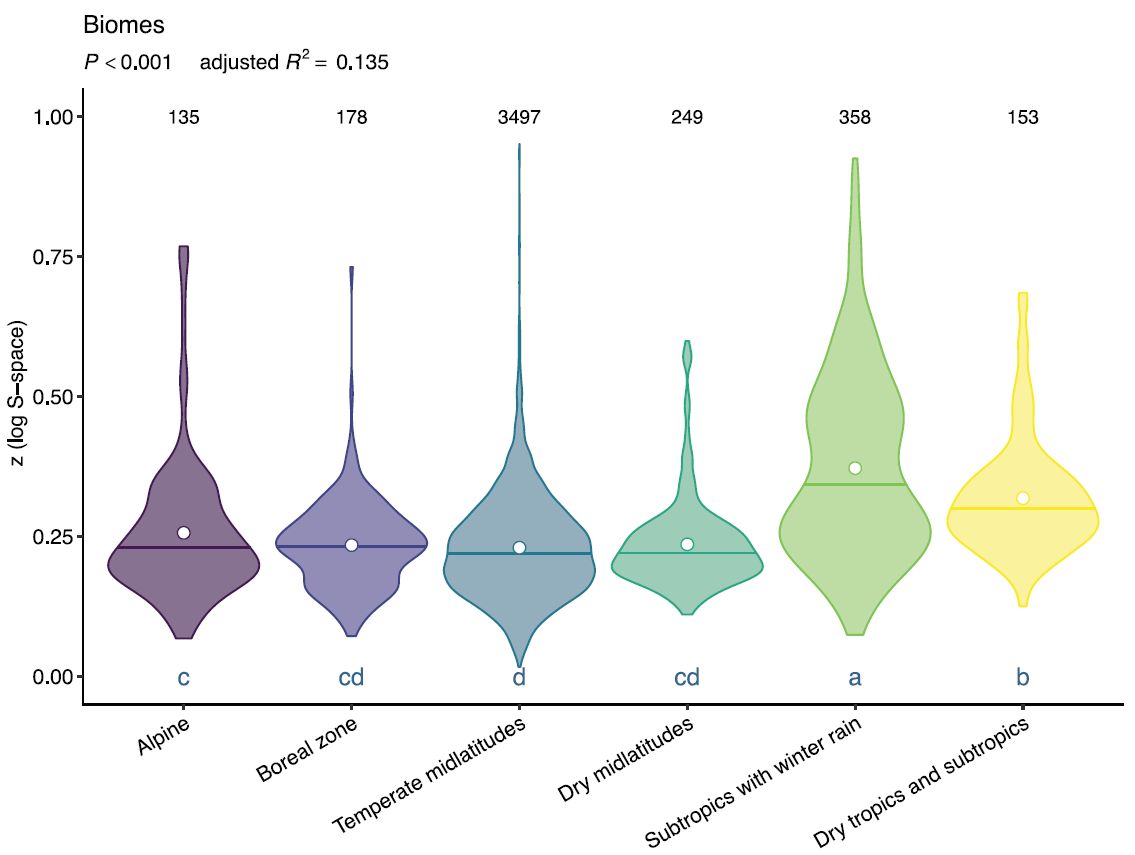
Opt-in paper #04B.2: Fine-grain beta diversity in Palaearctic open vegetation: variability within and between biomes and vegetation types
Start: 20 January 2019
Project leader(s): Iwona Dembicz (PL/CH) & Jürgen Dengler (CH/DE)
Summary:
We tested whether z-values differed between biomes, ecological-physiognomic vegetation types at coarse and fine levels and phytosociological classes. We found that z-values varied significantly among biomes and vegetation types. The explanatory power of area for species richness was highest for vascular plants, followed by complete vegetation, bryophytes and lichens. Within each species group, the explained variance increased with typological resolution.
Publication:
Dembicz, I., Dengler, J., Gillet, F., Matthews, T.J., Steinbauer, M.J., Bartha, S., Campos, J.A., De Frenne, P., Dolezal, J., García-Mijangos, I., Guarino, R., Güler, B., Kuzemko, A., Naqinezhad, A., Noroozi, J., Peet, R.K., Terzi, M., & Biurrun, I. 2021. Fine-grain beta diversity in Palaearctic open vegetation: variability within and between biomes and vegetation types. Vegetation Classification and Survey 2: 293–304.
Opt-out project #02: Benchmarking plant diversity of Palaearctic grasslands
Start: 18 January 2019
Project leader(s): Idoia Biurrun (ES)
Summary:
The GrassPlot Diversity Benchmarks provide high-quality data on species richness in open habitat types across the Palaearctic. These benchmark data can be used in vegetation ecology, macroecology, biodiversity conservation and data quality checking. While the amount of data in the underlying GrassPlot database and their spatial coverage are smaller than in other extensive vegetation-plot databases, species recordings in GrassPlot are on average more complete, making it a valuable complementary data source in macroecology.
Publication:
Biurrun, I., Pielech, R., Dembicz, I., Gillet, F., Kozub, Ł., Marcenò, C., Reitalu, ... & Dengler, J. 2021. Benchmarking plant diversity of Palaearctic grasslands and other open habitats (H. Kreft, Ed.). Journal of Vegetation Science 32.
https://onlinelibrary.wiley.com/doi/10.1111/jvs.13050
https://vegsciblog.org/2021/08/04/grassplot-marathon-richness-of-palaearctic-grasslands/
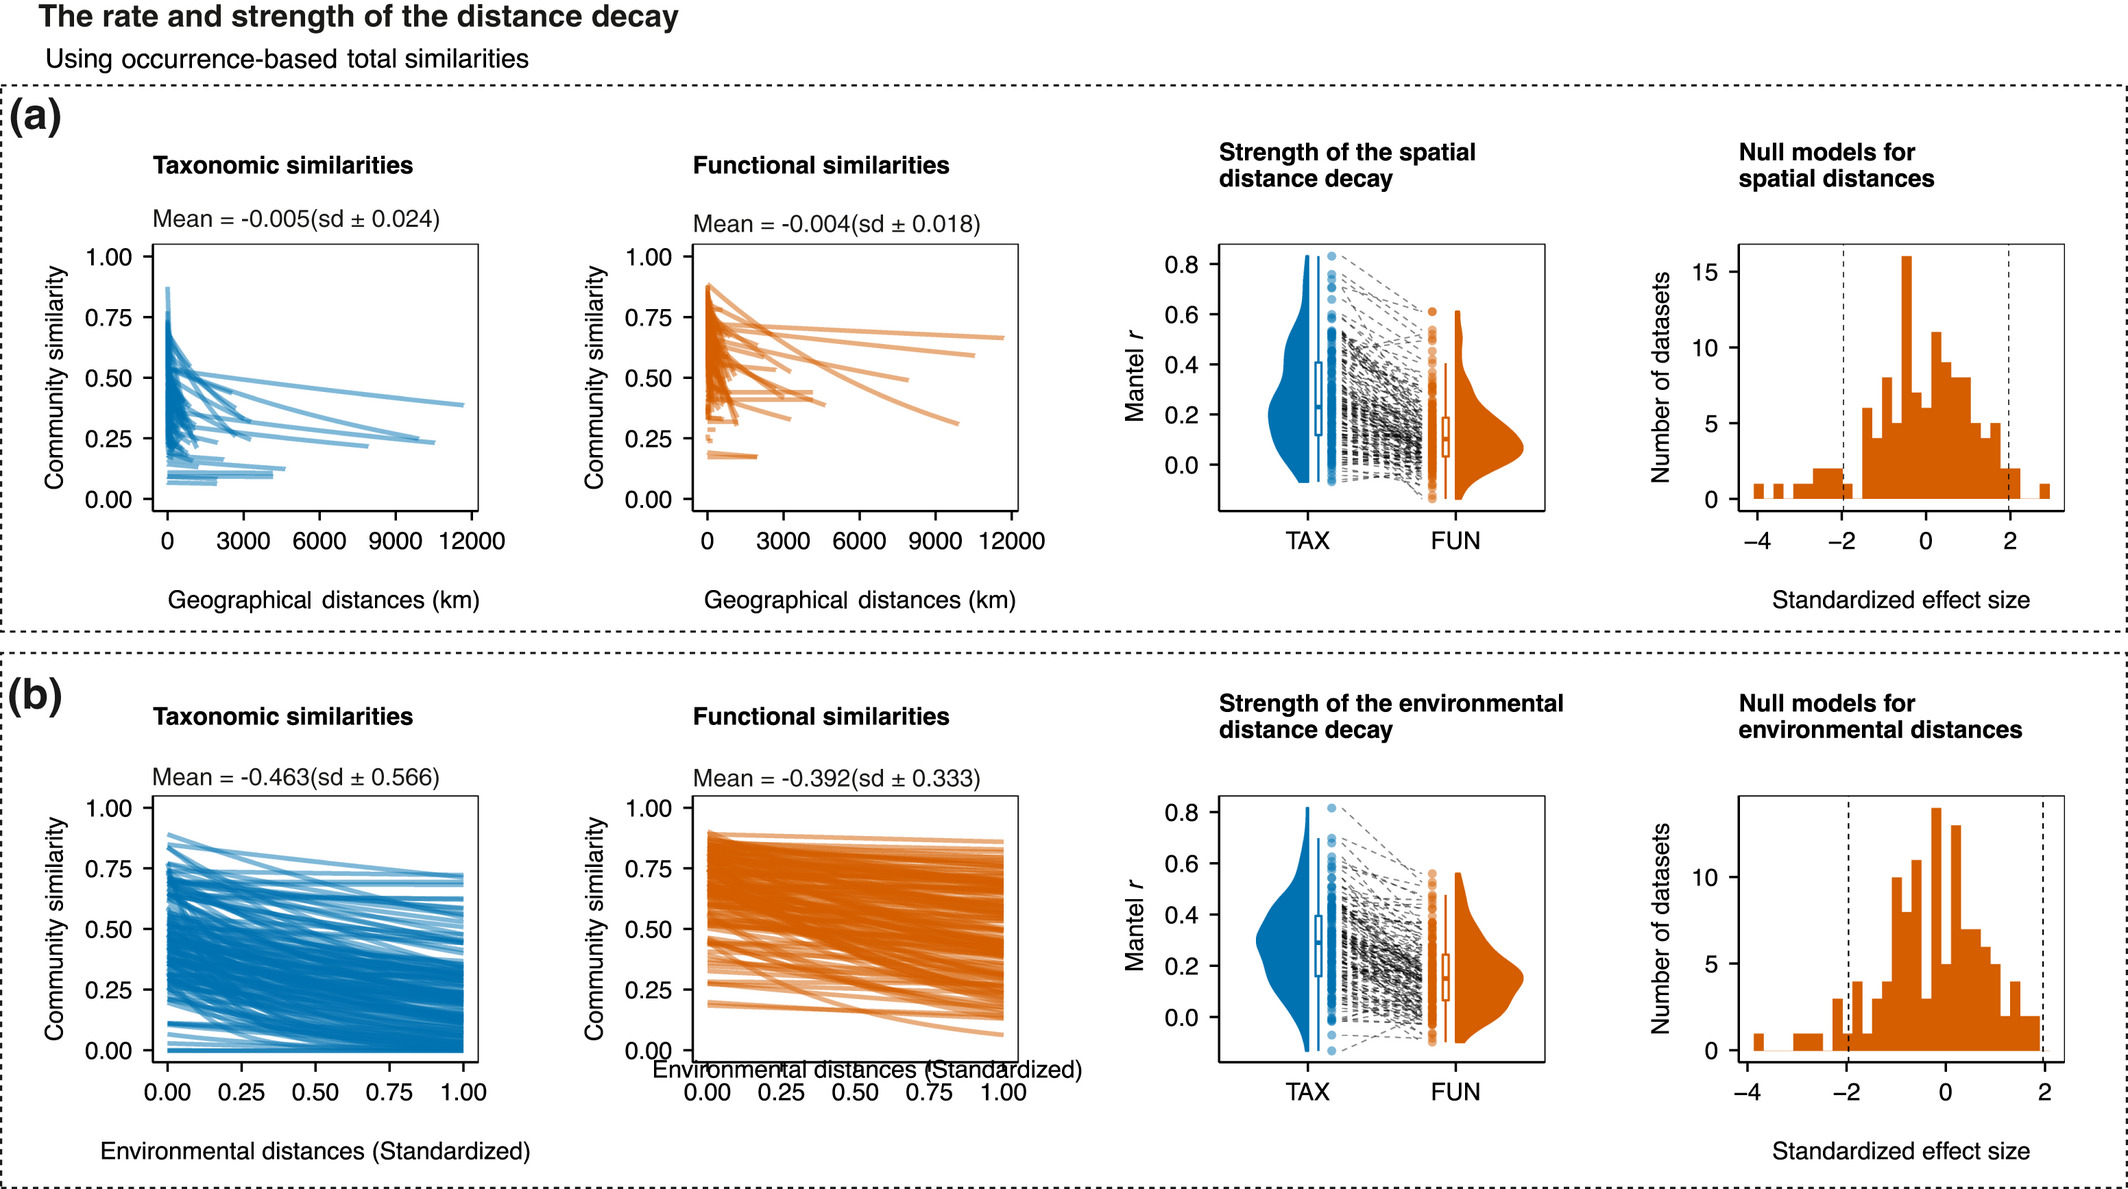
Paper project #18: Distance decay 2.0 – a global synthesis of taxonomic and functional turnover in ecological communities
Summary: This paper is not a GrassPlot paper s.str., but it uses the vascular plant data from the EDGG Field Workshops provided via GrassPlot together with many other datasets from various taxonomic groups worldwide.
Publication:
Graco‐Roza, C., Aarnio, S., Abrego, N., Acosta, A.T.R., Alahuhta, J., Altman, J., Angiolini, C., Aroviita, J., Attorre, F., (...), & Soininen, J. 2022. Distance decay 2.0 – A global synthesis of taxonomic and functional turnover in ecological communities. Global Ecology and Biogeography 31: 1399–1421.
https://onlinelibrary.wiley.com/doi/full/10.1111/geb.13513
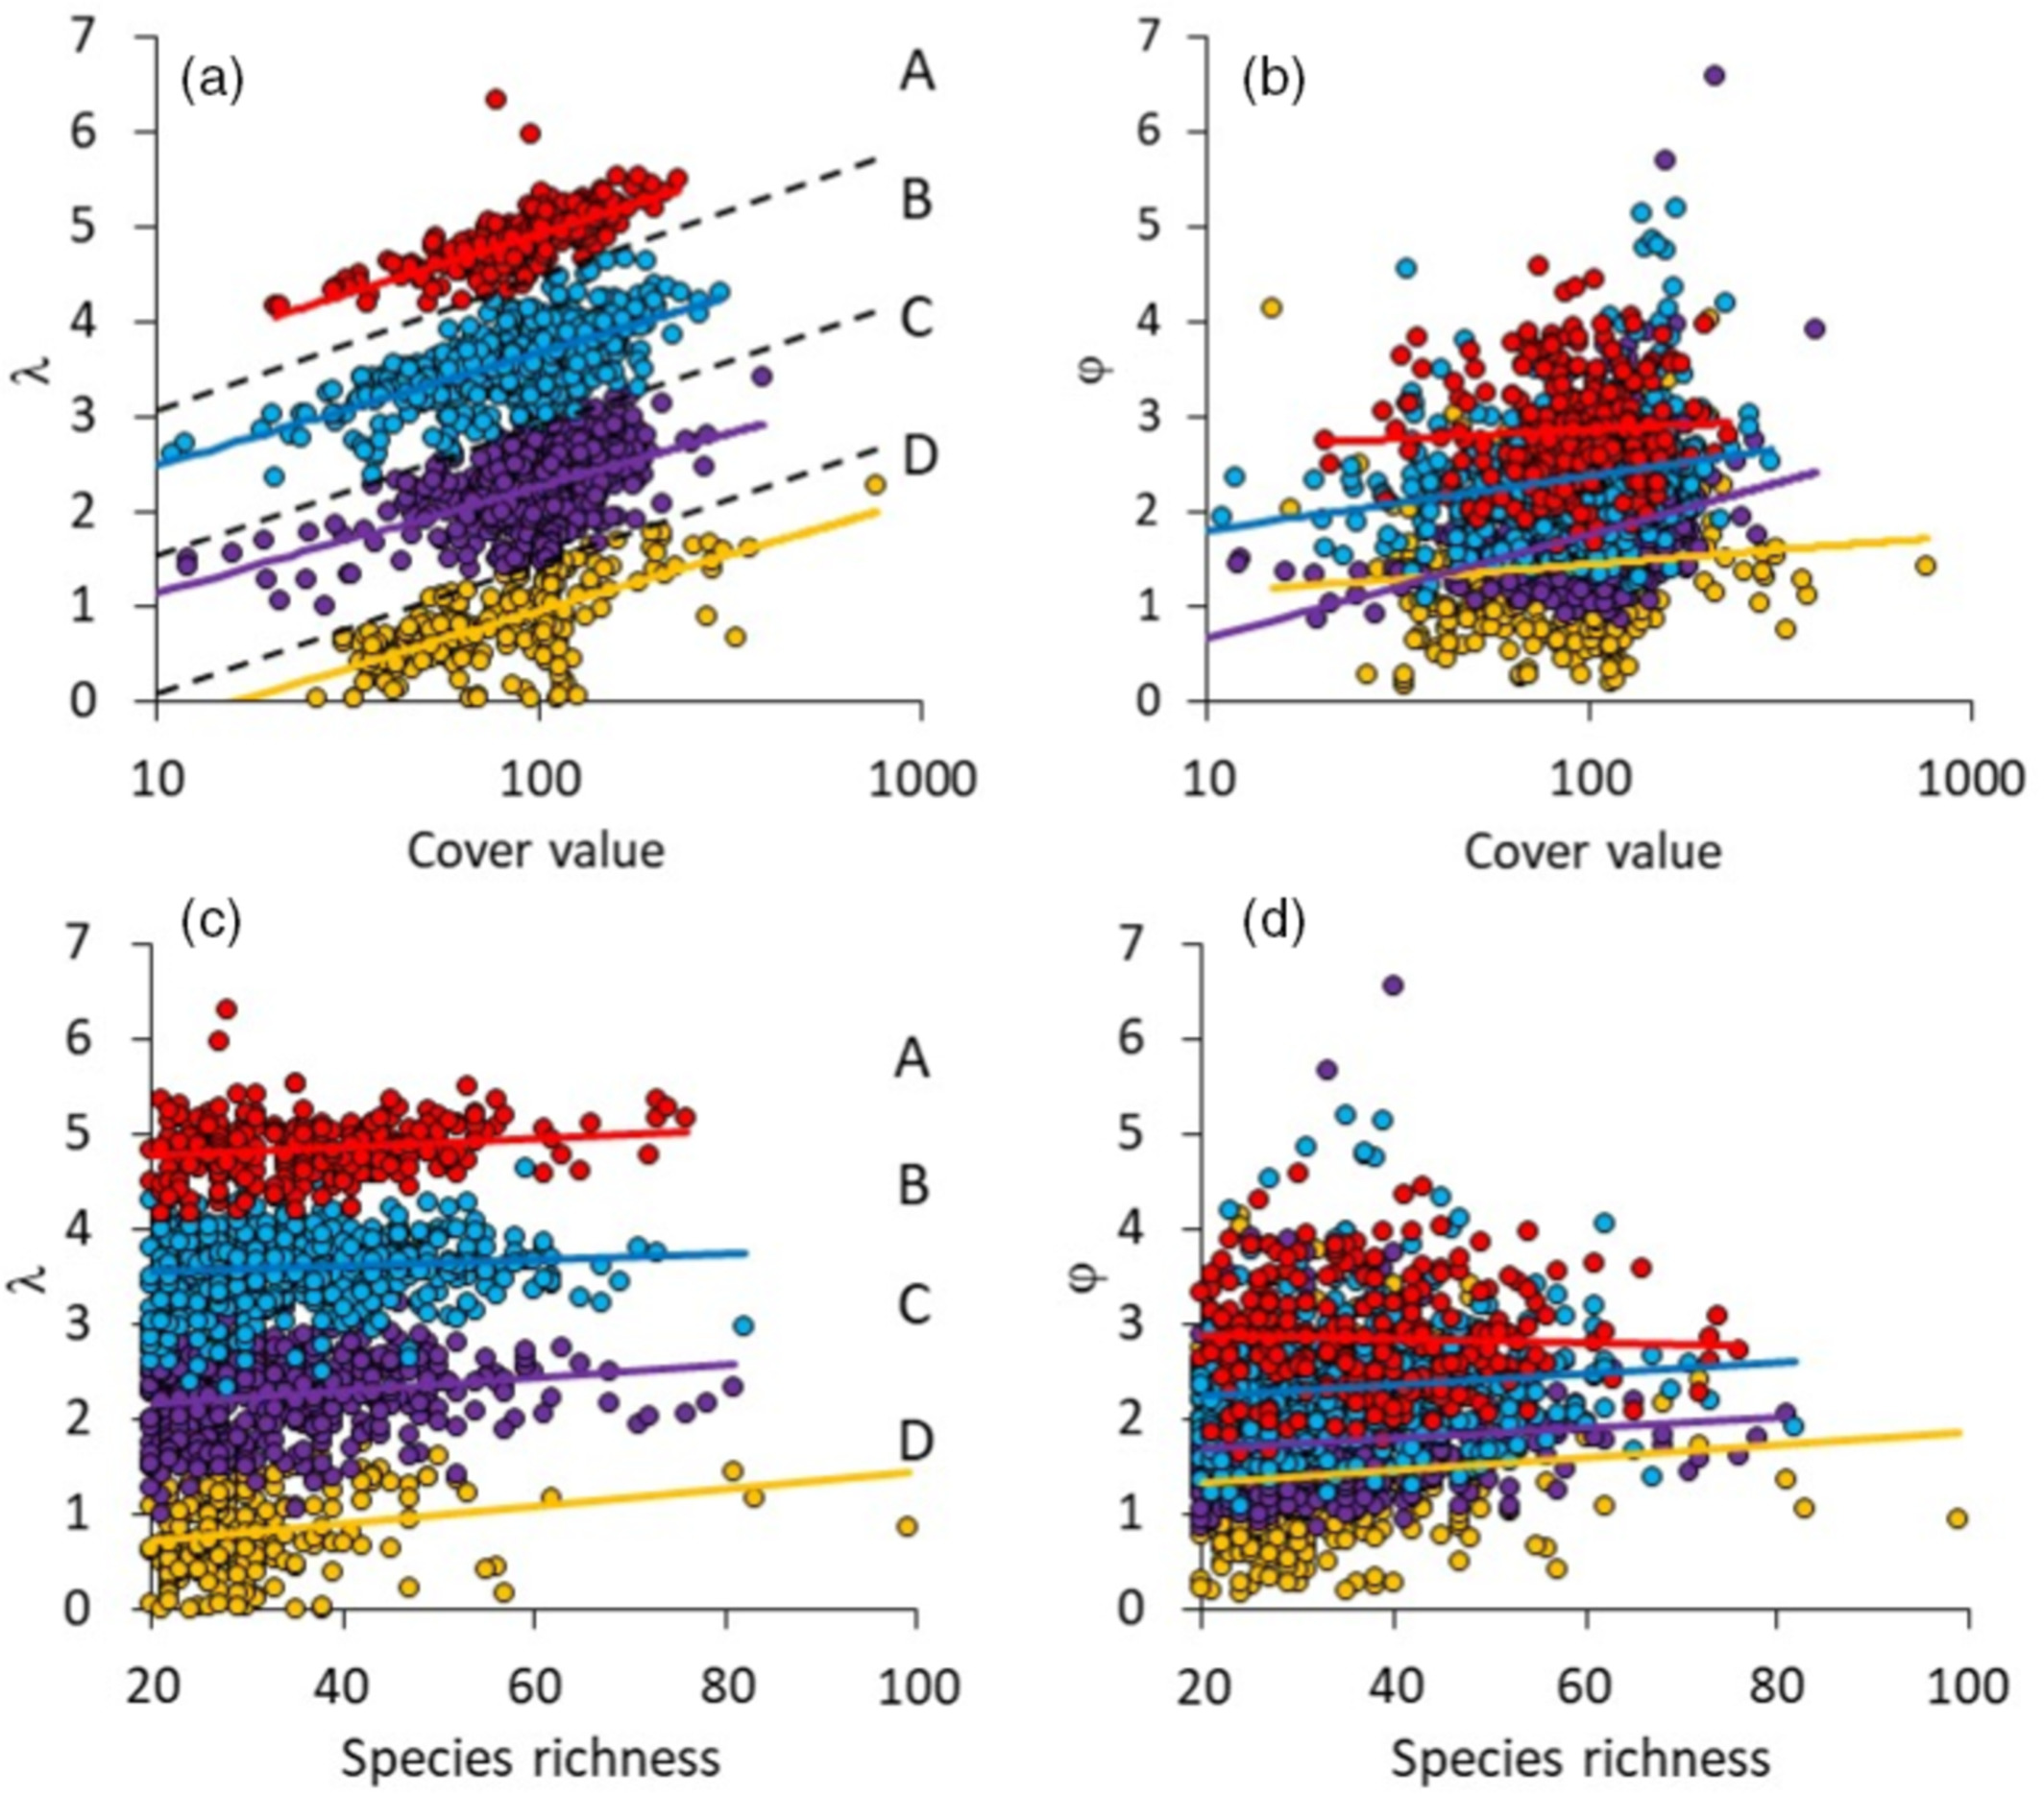
Opt-in paper #15: Environmental drivers and spatial scaling of species abundance distributions in Palaearctic grassland vegetation
Start: 19 December 2020
Project leader(s): Werner Ulrich
Summary: We extracted percentage cover values of all occurring vascular plants as proxies of their abundance in 1725 10-m2 plots from the GrassPlot database, covering 47 regional data sets of 19 different grasslands and other open vegetation types of the Palaearctic biogeographic realm. For each plot, we fitted the Weibull distribution, a model that is able to effectively mimic other distributions like the log-series and lognormal, to the species–log abundance rank order distribution. We calculated the skewness and kurtosis of the empirical distributions and linked these moments, along with the shape and scale parameters of the Weibull distribution, to plot climatic and soil characteristics. The Weibull distribution provided excellent fits to grassland plant communities and identified four basic types of communities characterized by different degrees of dominance.
https://esajournals.onlinelibrary.wiley.com/doi/10.1002/ecy.3725
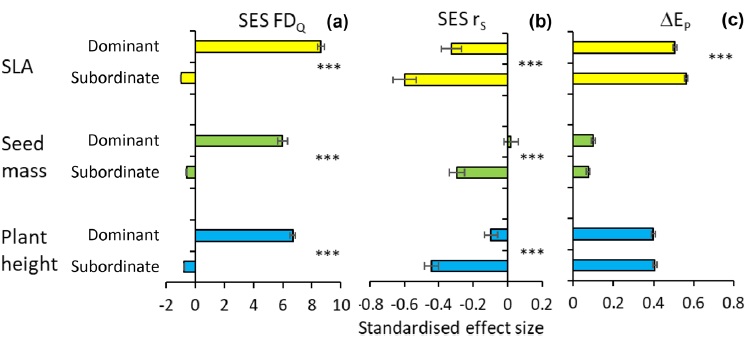
Opt-in paper #19: Biases in species richness data in large phytosociological databases
Start: 19 December 2020
Project leader(s): Remigiusz Pielech, Jürgen Dengler, Idoia Biurrun, Iwona Dembicz, Anna Kuzemko, Borja Jiménez-Alfaro, Florian Jansen
Summary: The local species abundance distribution (SAD) and the distributions of species functional traits (TADs) reflect plant community assembly. While dominants and rare species are well studied, subordinate species - intermediate in abundance yet often species rich - remain understudied. Using a large dataset of Palearctic dry and semi-dry grasslands and three traits (specific leaf area, seed mass, and height), we show that SAD and TAD rank orders are often negatively correlated, making TADs more even than SADs. Subordinates accounted for less than 15% of total abundance and trait space, and their functional diversity was lower than expected under a random (null) model. Climate seasonality and elevation were key predictors of subordinate abundance and functional diversity. Overall, subordinates differ from dominants in trait composition, indicating partial functional independence from dominants.
https://nsojournals.onlinelibrary.wiley.com/doi/10.1002/oik.11572
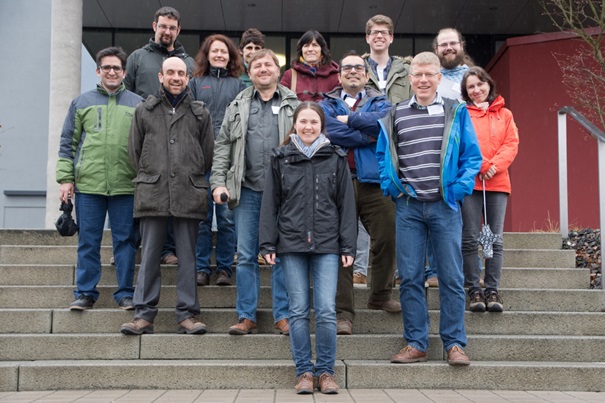
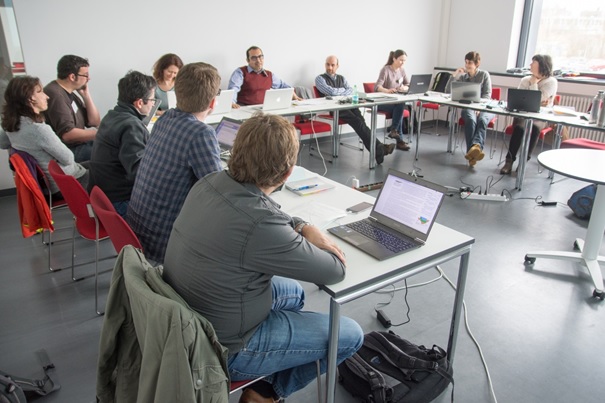
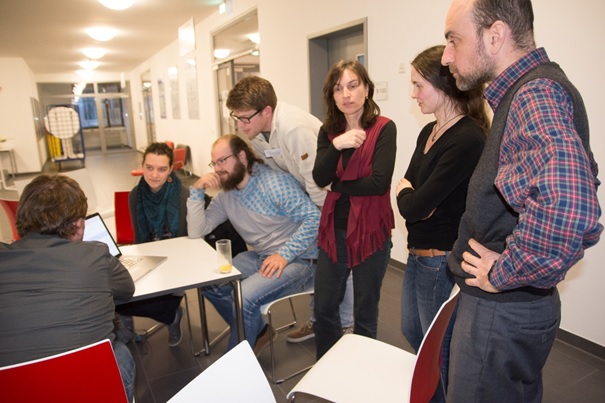
Thanks to funding from BayIntAn program of the Bavarian Research Alliance (BayFor) and co-funding from BayCEER, an international workshop on "Scale-dependent phytodiversity patterns in Palaearctic grasslands" took place in Bayreuth from 6-10 March 2017.
The main aims were the organisation of the further development of the database, planning of overarching analyses and papers of the data as well as third-party grant proposals based on them.
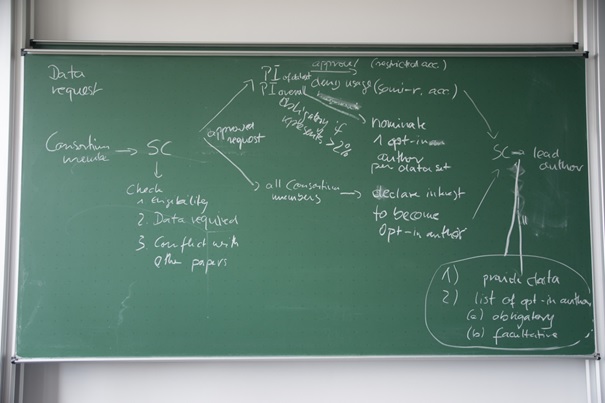
The 13 workshop participants from nine countries combined representative of the main data contributors with specialists in ecological theory and state-of-the-art statistical analyses of such huge macroecological datasets. During one intensive week the participants planned about one dozen papers based on the common database, but also coined a name for this database (GrassPlot) and developed bylaws that balance the rights and interests of data contributors and data users.
During the Workshop one of the participants, Prof. Dr. David Storch (Charles University of Prague), gave a public lecture on "Biodiversity scaling: between biology and geometry", closely related to some of the main research topics that are going to be addressed with the GrassPlot data.
More information about the workshop can be found here.
Host: Jürgen Dengler (BayCEER, DE)
Participants: Idoia Biurrun (ES), Timo Conradi (DK/DE), Iwona Dembicz (BayCEER, DE/PL), Goffredo Filibeck (IT), Itziar García-Mijangos (ES), Riccardo Guarino (IT), Elisabeth Hüllbusch (BayCEER, DE), Monika Janišová (SK), Alireza Naqinezhad (IR), Santiago Soliveres (CH/ES), Manuel J. Steinbauer (DK/DE), David Storch (CZ), Viktoria Wagner (CZ/AT)
Remote participants: Steffen Boch (CH/DE), Alessandro Chiarucci (IT), Francesco de Bello (CZ), Swantje Löbel (SE/DE), Werner Ulrich (PL)
General
GrassPlot Call (EDGG Bulletin 34, 2017)
GrassPlot Data entry form, Entry form for datasets and Consortium members and Explanation of variables
Comparison of GrassPlot, EVA and sPlot
History and content of GrassPlot
GrassPlot Newsletters
GrassPlot Newsletter No. 11 (November 2023)
GrassPlot Newsletter No. 10 (March 2023)
GrassPlot Newsletter No. 9 (April 2021)
GrassPlot Newsletter No. 8 (December 2020)
GrassPlot Newsletter No. 7 (January 2020)
GrassPlot Newsletter No. 6 (February 2019)
GrassPlot Newsletter No. 5 (January 2019)
GrassPlot Newsletter No. 4 (October 2018)
GrassPlot Newsletter No. 3 (June 2018)
GrassPlot Newsletter No. 2 (May 2017)
GrassPlot Newsletter No. 1 (March 2017)
Presentations from conferences
Benchmarking plant diversity of Palaearctic grasslands (talk, IAVS 2019)
Patterns and drivers of fine-scale beta-diversity in Palaearctic grasslands (talk, IAVS 2019)
Species-area relationships in continuous vegetation: evidence from Palaearctic grasslands (talk, IAVS 2019)
The new database of multi-scale plant diversity of Palaearctic grasslands: invitation to contribute and opportunities for analyses (poster at Macroecology conference, Vienna 2017)
Scale-dependent patterns of plant diversity and species-area relationships in Palaearctic grasslands: first results based on GrassPlot (poster at Macroecology conference, Vienna 2017)